
Man-Made CO2 Doesn’t Cause Global Warming
Tom Tamarkin
In the United States, it is estimated that 3.2 trillion dollars is spent on “climate mitigation” related issues each year. Given America’s population of 333.3 million people, this means that every man, women and child “spends $9,600 per year because of “climate matters.” Thank about it. Every person in the United States supports climate change mitigation to the tune of close to $10,000 per year. And the official “single adult poverty rate” in America is $14,500.00,
The fundamental scientific Law of Conversation of Mass and Energy says neither matter nor energy can be created or destroyed (but can be changed from one form to the other.) This prevents any heat buildup in the atmosphere related to so called greenhouse gases from increasing the temperature on the Earth’s surface over time. It can, theoretically cause a delay in cooling although given the “trace gas *” percentage of the total atmosphere (78% Nitrogen & 21% Oxygen) that delay is unmeasurable.
Carbon dioxide (CO2) has been framed in the media: here’s how .
So called greenhouse gases such as the primary one, aqueous water vapor (H2O), carbon dioxide (CO2), nitrous oxide (N2O,) and methane (CH4) don’t duplicate the workings of a plant greenhouse which simply trap heat from the Sun through clear glass or plastic in an airtight structure. The term greenhouse gas is scientifically obfuse as all gasses in the Earth’s atmosphere trap heat to some extent, thereby making the term “greenhouse gases” meaningless.
Why has the atmospheric CO2 level increased?
Net atmospheric carbon dioxide concentration is controlled and regulated by Henry’s Law.
ClimateCite has built an extensive website on Henry’s Law.
Henry’s Law is a fundamental law of physics which establishes the partial pressure equilibrium between gases such as carbon dioxide (CO2) in the air and the CO2 dissolved in water and principally the world’s oceans. As the surface temperature of large surface areas of the oceans increase, CO2 is liberated. Conversely as they cool, CO2 is absorbed.
Contrary to the popular belief of the press and political establishments, temperature increases always precede CO2 increases.
Over the last 100 plus years, vast surface areas of the world’s oceans are have become slightly warmer due to the Sun and related astronomical issues explained in Dr. Valentina Zharkova’s recent paper as she explains in detail in her interview.
*Trace “greenhouse gasses” parts per million (ppm) / percentage of total atmosphere at 1,000 feet above mean sea level: Carbon dioxide (CO2,) 0.04%, 421 ppm, methane (CH4,) 0.00017% 1.7 ppm, nitrous oxide (N2O,) 0.32 ppm.
 Solar magnetic field effects on terrestrial temperature and sea level
Prof. Valentina Zharkova. Ph.D.
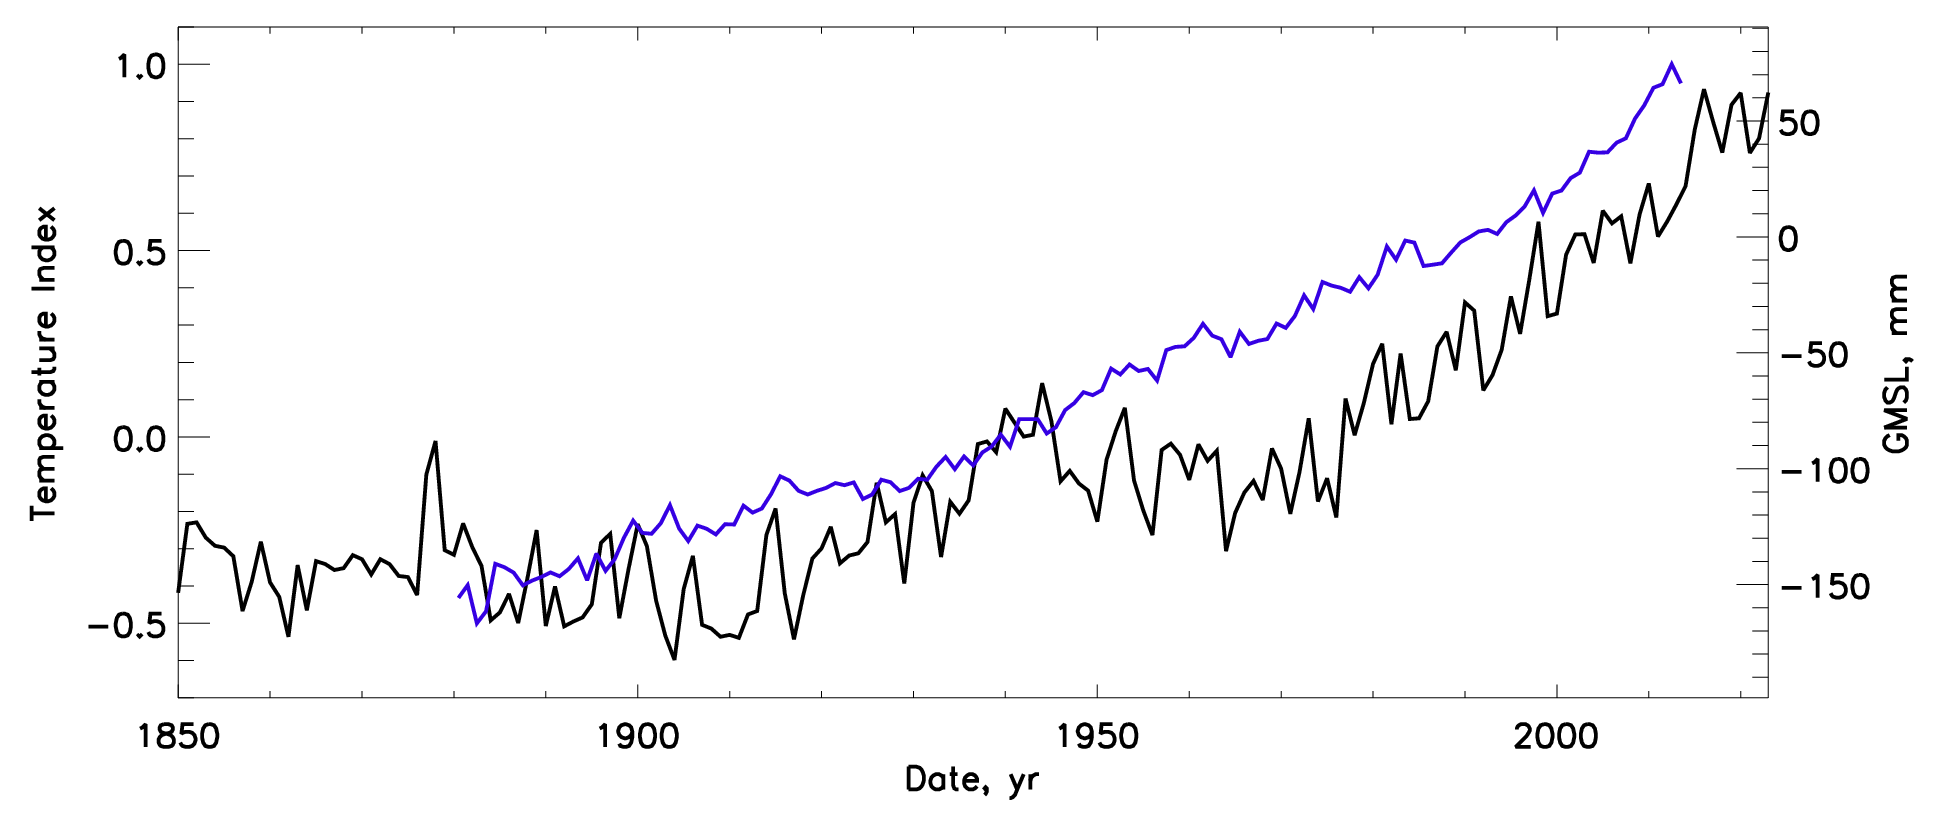
Figure 1. The close variations of the sea level (blue curve) to the terrestrial temperature variations measured by HadCRUT (black curve). Courtesy of Zharkova and Vasilieva, 2023, Natural Sciences, https://www.oalib.com/paper/6812235
Wavelet analysis of the GLB terrestrial temperature
Wavelet analysis of the GLB terrestrial dataset which clearly indicates the periods of 21.4 years (double sunspot solar cycle, or 21.4 year cycle solar eigen vectors) and 36 years.
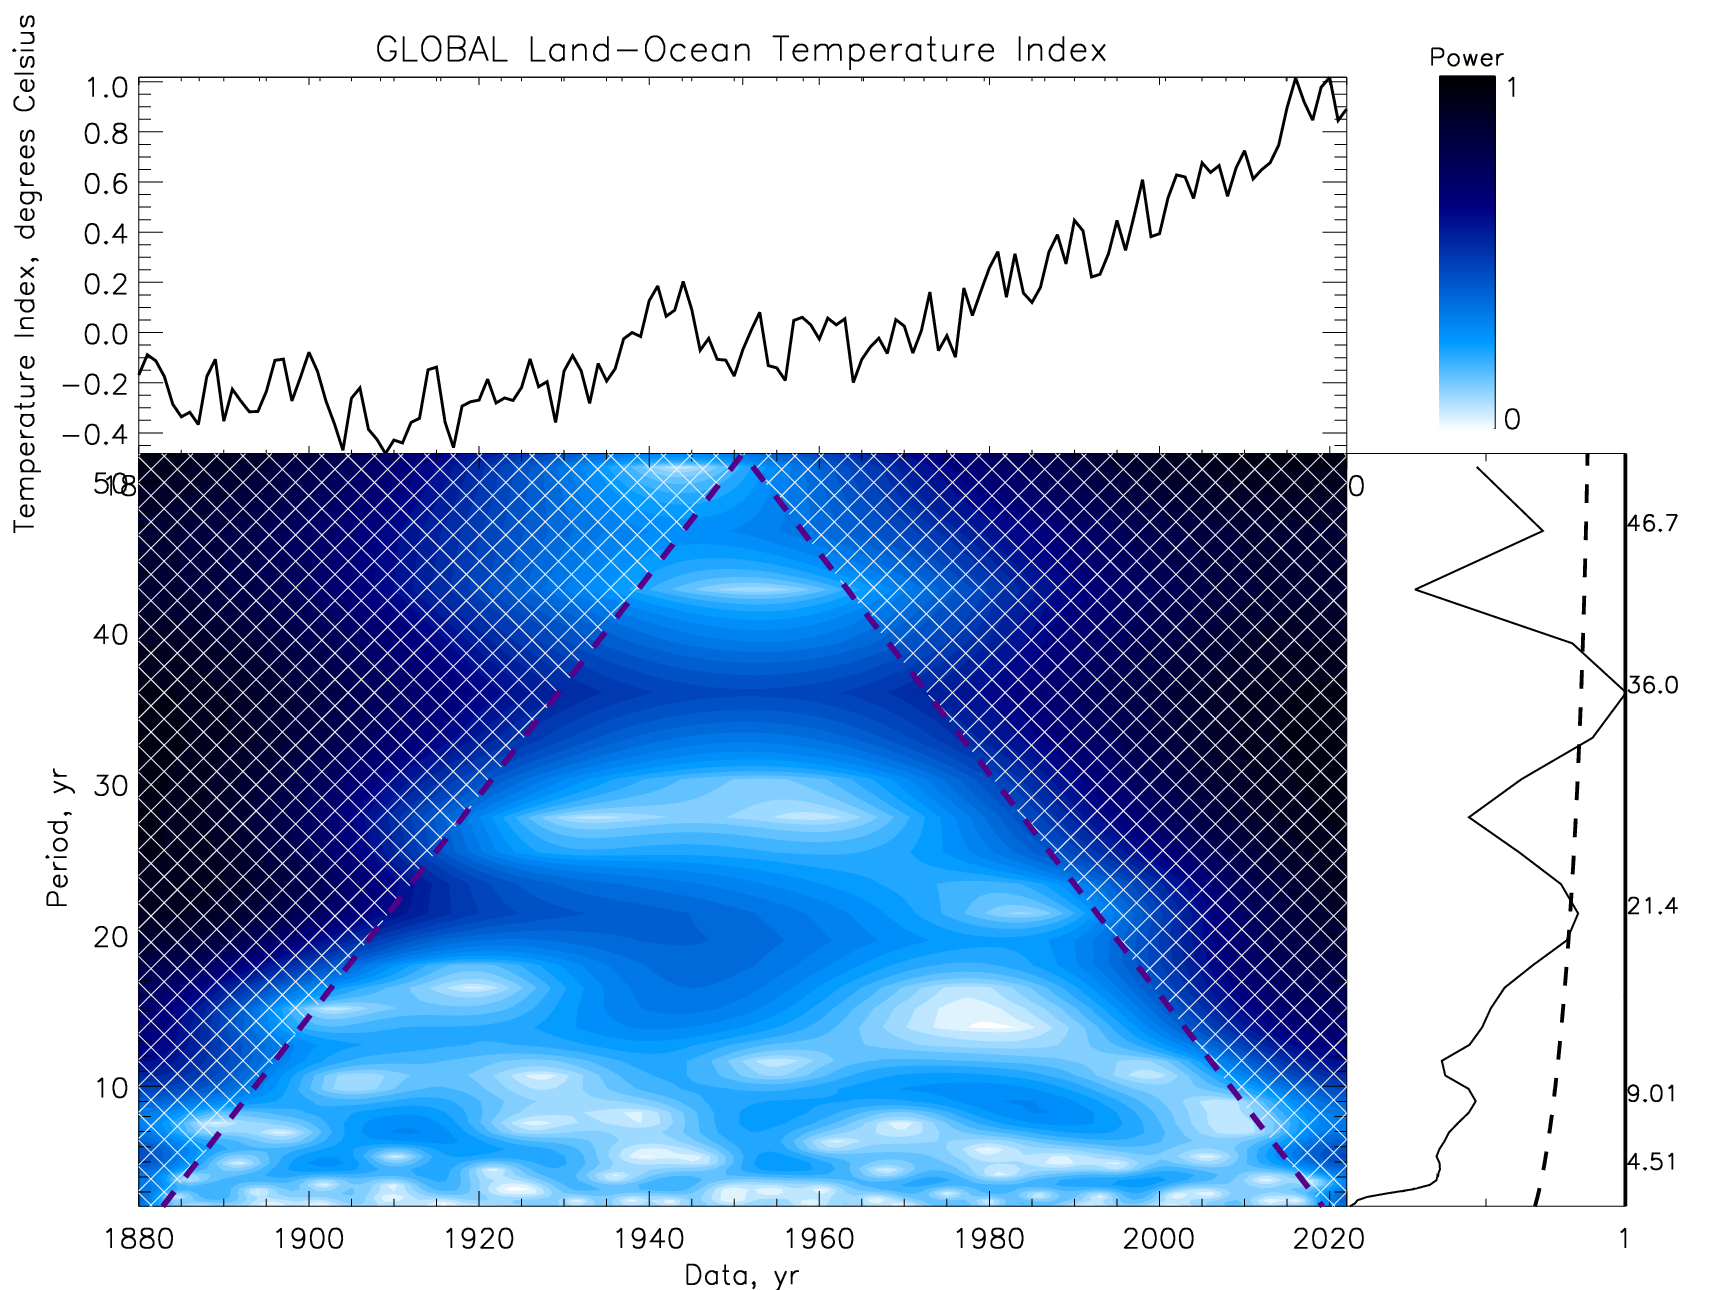
Figure 2. The GLB terrestrial temperature variations (upper plot), the wavelet spectrum of temperature (bottom plot) with the power marked by colour bar (the top right plot). The global wavelet spectrum of temperature is shown by the black solid line), 95% confidence interval by the black dashed line. Courtesy of Zharkova and Vasilieva, 2023, Natural Sciences,https://www.oalib.com/paper/6812235
Solar magnetic waves from the two biggest eigen vectors and their summary curve derived with Principal Component Analysis from the solar background magnetic field of the daily magnetograms taken by the Wilcox Solar Observatory, Stanford University, US
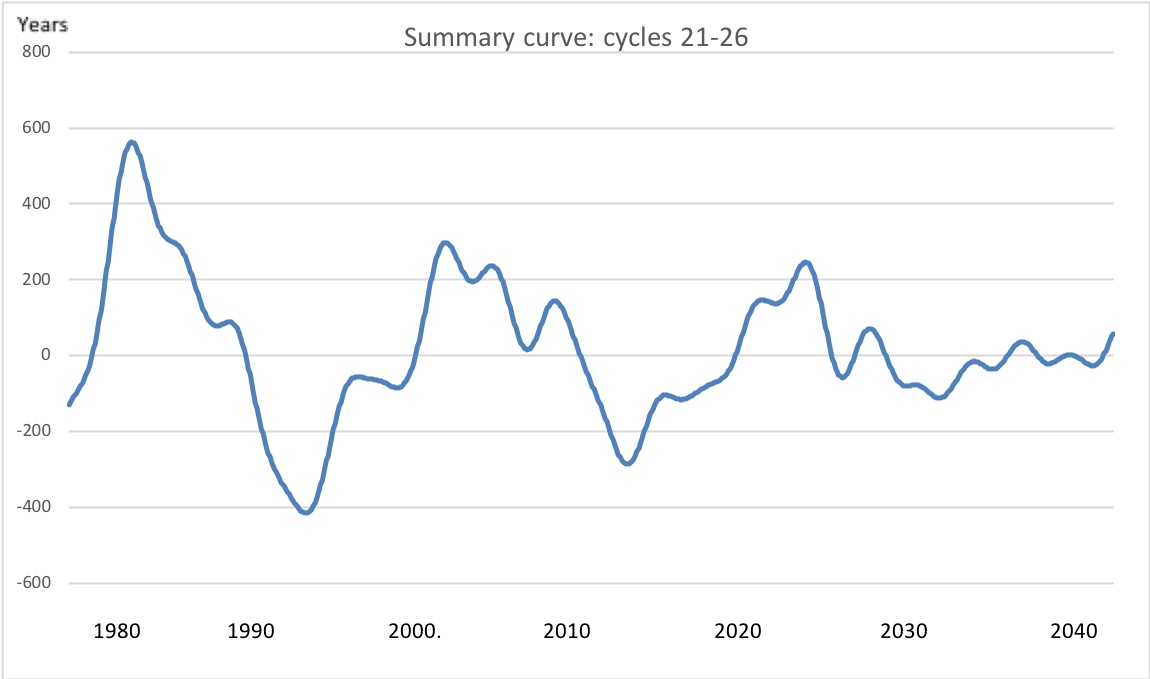
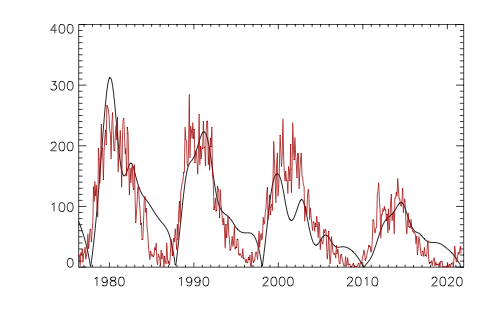 Figure 3 Top plot: The summary curve (in arbitrary units) of two principal components, PCs, for cycles 21 – 26 derived from the magnetic field data for cycles 21 – 23 and extrapolated for cycles 24, 25 and 26 (courtesy of [40]). Bottom plot: Modulus summary curve, in arbitrary units, derived from the summary curve above overplotted on the averaged sunspot numbers in cycles 21 – 24 used as the current solar activity index (courtesy of [42]). Courtesy of Zharkova and Vasilieva, 2023, Natural Sciences, https://www.oalib.com/paper/6812235
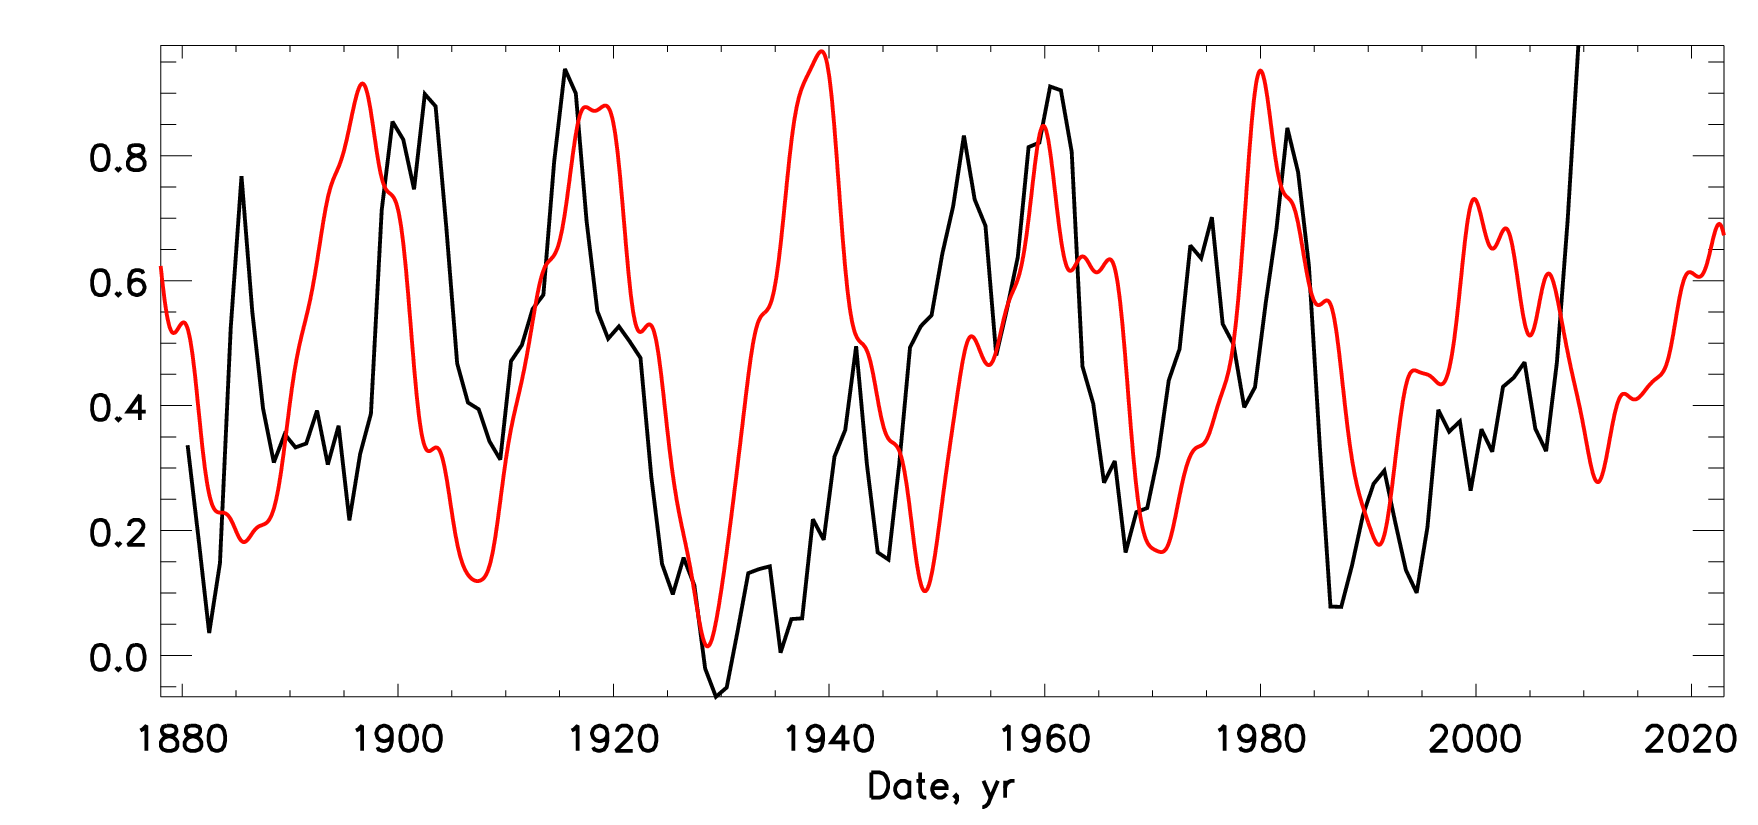
Figure 4. The variations of the level of the world ocean level (black line) versus the summary curve of SBMF (red curve). Courtesy of Zharkova and Vasilieva, 2023, Natural Sciences, https://www.oalib.com/paper/6812235
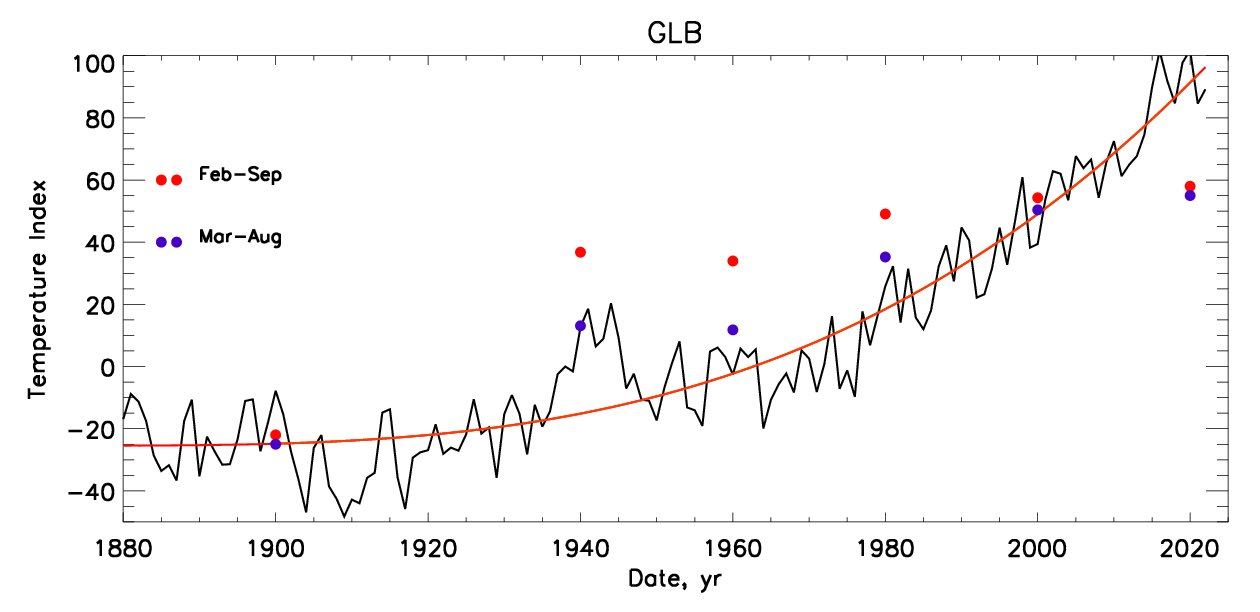
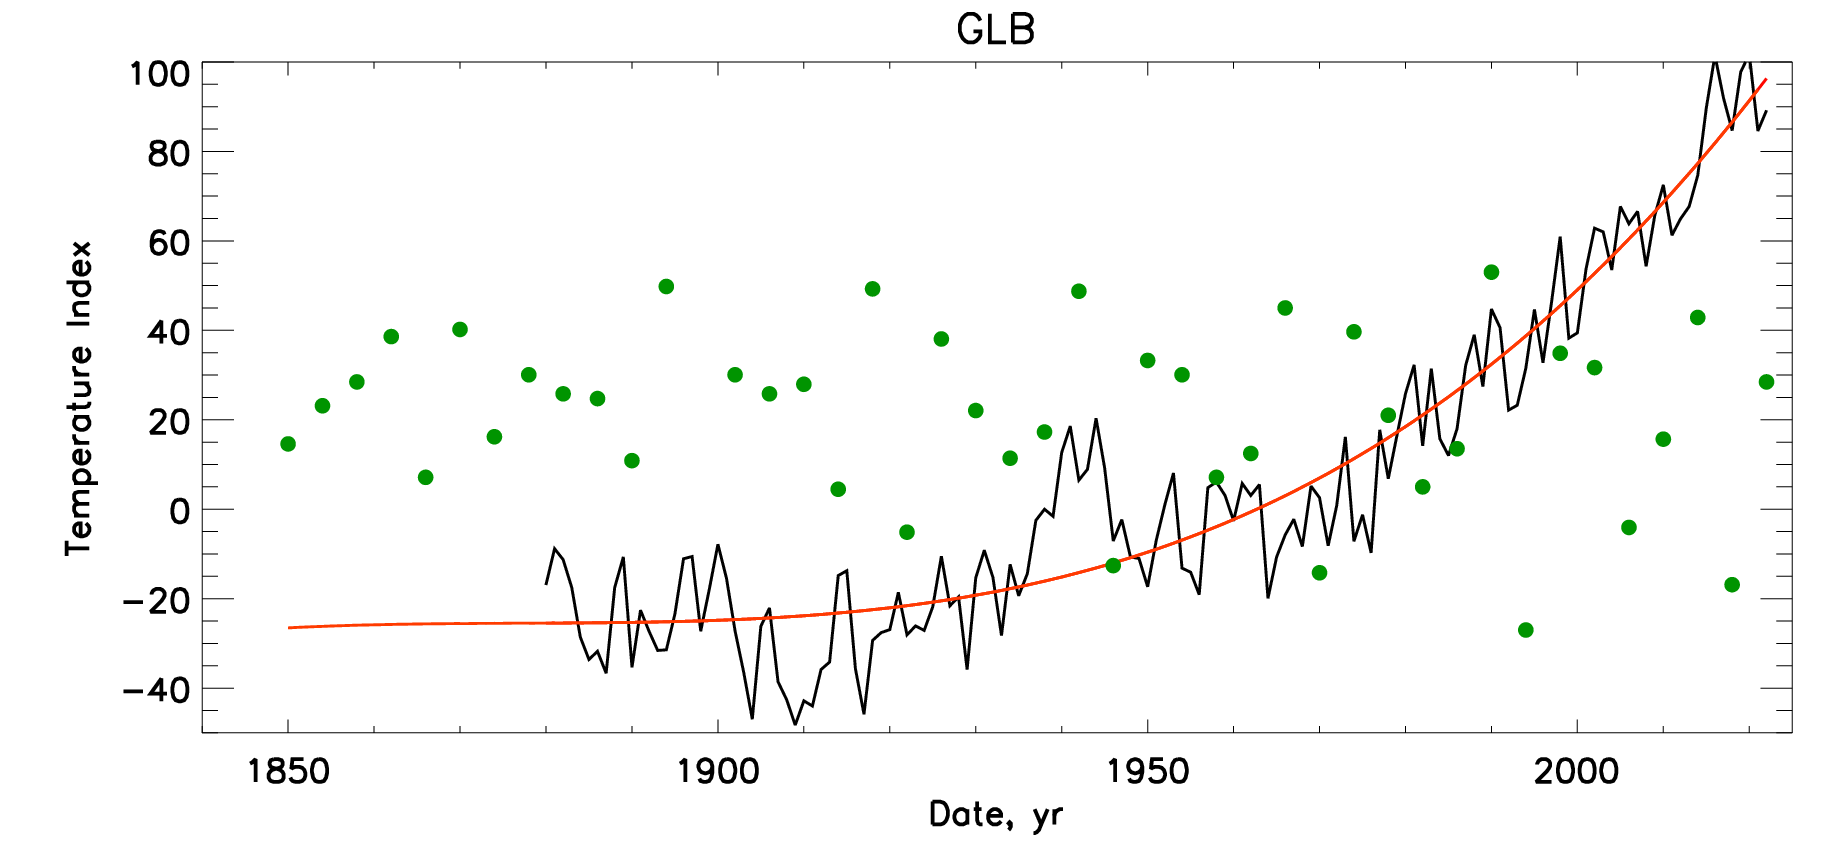
Figure 5. Top plot: The terrestrial temperature variations (black line) and averaged temperature (red line) versus the total solar irradiance (TSI) of the Sun affected by SIM in the spring- summer months as per the legend on the plot. Bottom plot: The temperature plot as above. The dots show the annual total solar irradiance affected by SIM averaged for every 4 years including the leap years. The solar irradiance is calculated by adding the daily irradiance for all 12 months in the Northern hemisphere when the Sun is closest to the Earth’s orbit [51]. Courtesy of Zharkova and Vasilieva, 2023, Natural Sciences, https://www.oalib.com/paper/6812235.
The current extremely small increases in CO2 seen over the last 100 years have been falsely attributed to man’s urban development and the use of fossil fuels.
Man’s increase in generating CO2 does not increase the NET total world atmospheric mass of CO2 at the end of the day, as it is regulated by Henry’s Law. The calls by various countries and commercial groups to drastically reduce the use of hydrocarbon based fuels are not only uncalled for, but are contrary to the basic human needs of the world’s 7.5+ billion people and could only be achieved by an order of magnitude (tenfold) decrease in worldwide population as explained in “Where Does Energy On This Planet Come From?“

