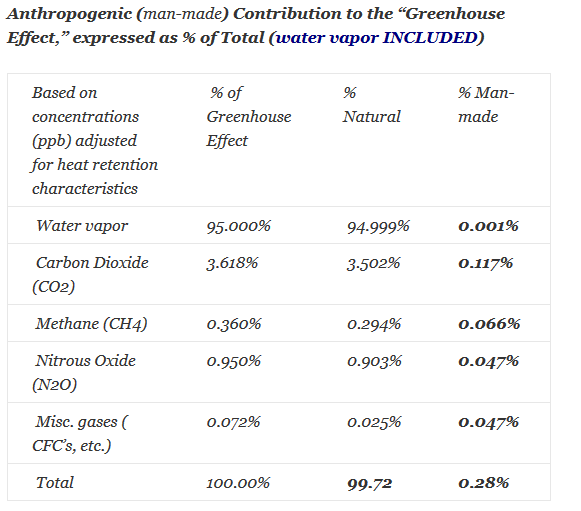
Anthropogenic Global Warming (AGW), now called climate change because the world is not warming, originated at the 1975 “The Atmosphere: Endangered and Endangering” conference, organized by anthropologist Margaret Mead, and Paul Erlich, author of the “Population Bomb.” In the early 1980s “The Club of Rome” embraced the empirically unprovable “Radiated Greenhouse Gas Emissions” hypothesis as a means to scare people into believing abundant inexpensive energy must be restricted because it creates catastrophic global warming. It has not and does not. Forty years of lower troposphere average global temperature readings show the Earth’s temperature has gone up and down by slightly less than +/- 0.45 Degrees C. Water vapor comprises 95% of all greenhouse gases. Carbon Dioxide is a trace gas. Manmade CO2 can only be responsible for 0.117% of any warming from all combined greenhouse gas including water vapor. Most of the balance comes from gasification of the oceans which is a function of temperature. Cold water dissolves more CO2 than warm water. Temperature increases always precede CO2 increases with a significant lag. The amount of “warming” produced by manmade CO2 is so low it is virtually unmeasurable. A comparison of the atmospheric CO2 concentrations from 1979 to 2018 shows no Pearson Correlation to temperature. However there is strong correlation to decreases in temperature caused by volcanic activity and increases in temperature caused by El Niño events, as shown in the chart below.
Yearly temperature variation and atmospheric CO2 levels, 1979 – 2018
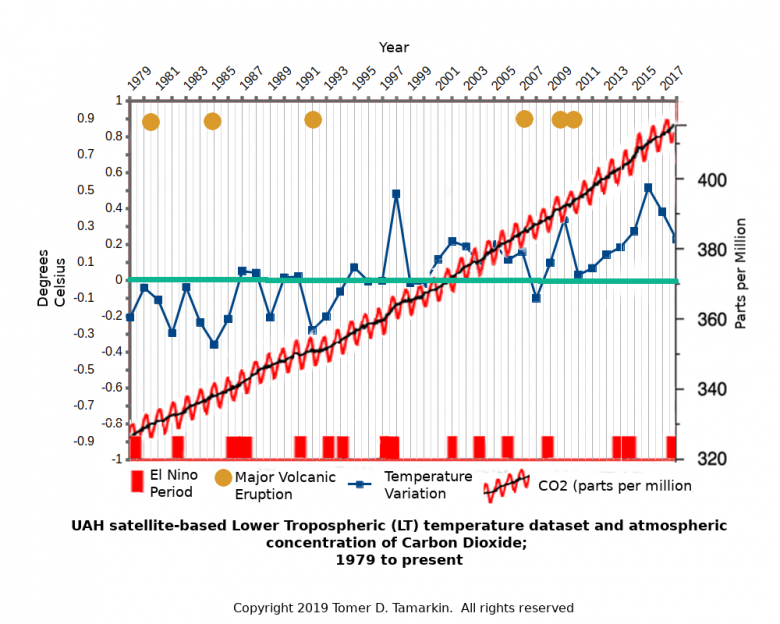
Correlations of decrease in Average worldwide temperature and volcanic activity are high.
Correlation of increase in average worldwide temperatures and El Niño events are high.
Correlation of atmospheric CO2 centration and temperature increases are extremely weak or nonexistent. See Pearson Correlation analysis.
UAH Temp Dataset | CO2 Concentration Dataset
Yearly temperature variation and atmospheric CO2 levels. See the correlation?
Forty years of annual temperature variations and atmospheric carbon dioxide concentrations are presented on one chart. There is no correlation between CO2 and temperature. None! Never in the course of human events has man spent so much money on so little…. But then what’s a trillion dollars here and a trillion dollars there?
Temperature variation is based on the UAH satellite based lower tropospheric data set. This is presented as the 30 year average, 1981-2010. It does not change the ranking; it is merely an additive offset. For yearly averages one could just use the raw temperatures, but scientists use monthly anomalies so much, it’s important to have removed the seasonal cycle, which dominates the variability. The Carbon Dioxide (CO2) curve is the universally accepted Keeling curve based on the Mauna Loa, Hawaii monitoring station and obtained from the NOAA data base. The red sinusoidal lines through the CO2 curve represent the seasonal variations caused by plant life CO2 intake.