
The Shocking Climate Graph @climateofgavin Doesn’t Want You To See
WUWT Anthony Watts | Feb. 3, 2021
Just a couple of days ago, climate scientist Dr. Roy Spencer suggested U.S. Warming Trends could be largely spurious.
In his analysis, Dr. Spencer examined another dataset maintained by the National Oceanic and Atmospheric Administration (NOAA) and found that when adjusted for population density, weather stations used to measure climate trends report lower long term temperature trends:
“… the highest population density stations had ~0.25 C/decade warming trend, with a reduced warming trend as population density was reduced…”
He adds:
“Significantly, extrapolating to zero population density would give essentially no warming in the United States during 1973-2011. As we shall see (below) official temperature datasets say this period had a substantial warming trend, consistent with the warming in the highest population density locations.
How can one explain this result other than, at least for the period 1973-2011, (1) spurious warming occurred at the higher population density stations, and (2) the evidence supports essentially no warming if there were no people (zero population density) to modify the microclimate around thermometer sites?
I am not claiming there has been no global warming (whatever the cause). I am claiming that there is evidence of spurious warming in thermometer data which must be removed.”
He also cited my work published at AGU in 2015:
Note that this is about the same as the trend I get with the stations having the highest (rather than lowest) population density. Anthony Watts reported qualitatively similar results using different data back in 2015.
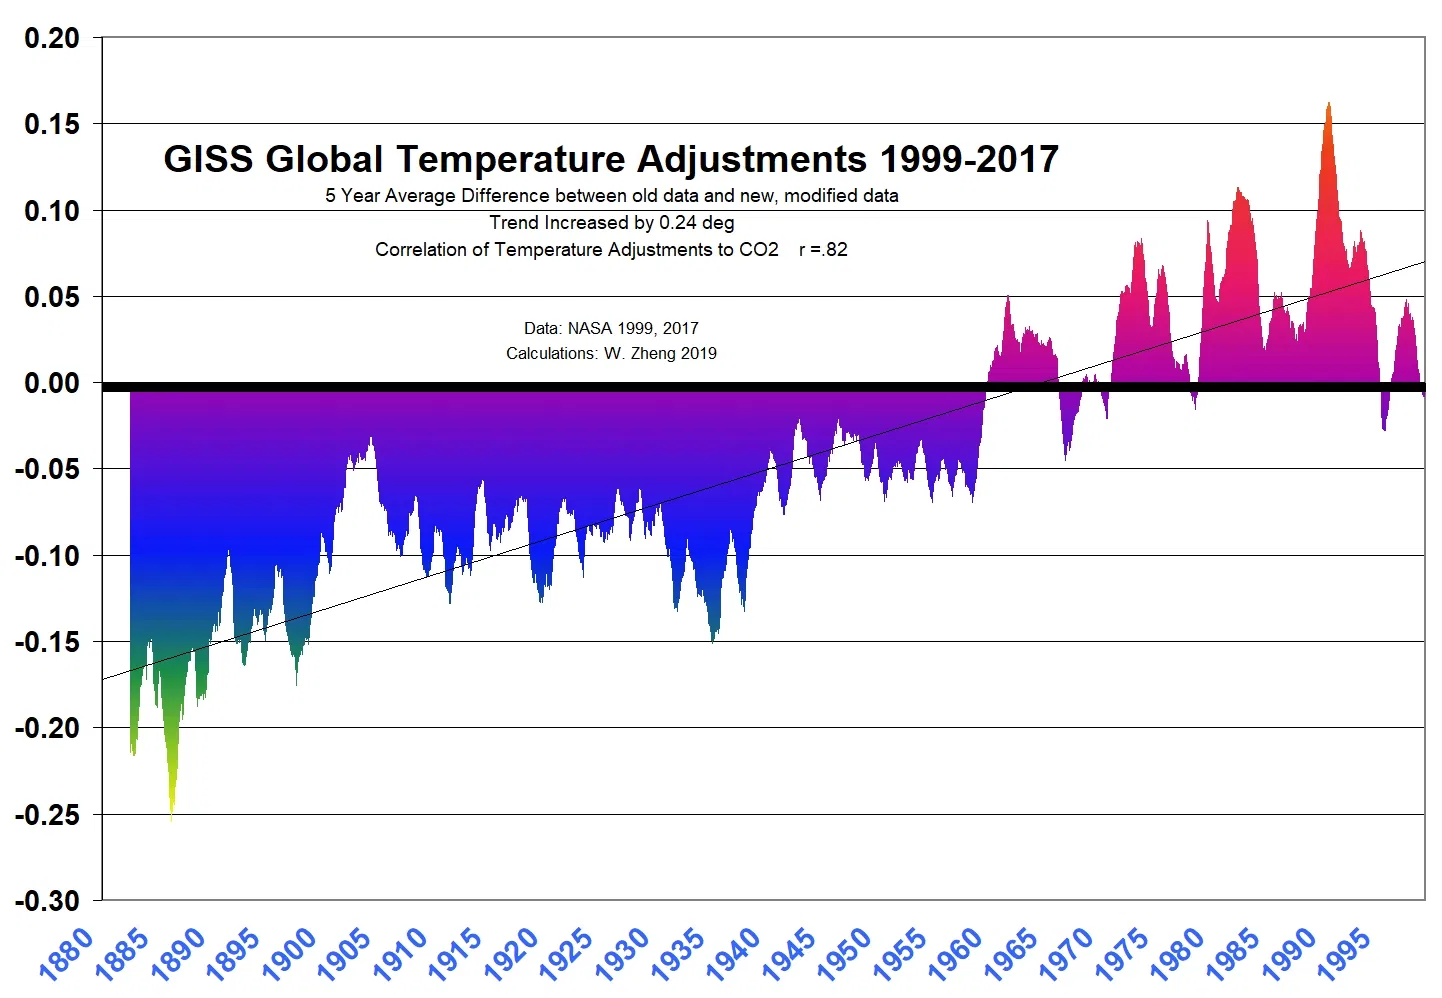
Now, along the same lines, in a response to a Tweet I made today, panning the Biden appointment of NASA GISS Dr. Gavin Schmidt to a senior advisor on climate to the White House, atmospheric scientist Dr. Wei Zhang had this to say, and included a graph of his analysis I had not seen before:
We know with Gavin in charge , the temperature will go up… No matter what the thermometers say. I’m still waiting for a plausible explanation of why temperature adjustments are almost perfectly correlated with carbon dioxide. Would expect correlation to be near zero.
Wei Zhang adds in a follow up Tweet responding to another poster who ignorantly tries to tell him it the greenhouse effect 101, bold mine:
That’s not what I said. Why do temperature ADJUSTMENTS correlate with CO2? The probability that this happens by chance is shockingly close to zero.
For those of you that don’t immediately grasp the significance of this, here’s the meat of it.
What Wei Zhang has illustrated is almost a perfect correlation between adjustments to the surface temperature record made by NASA GISS (and Gavin Schmidt) and the concentration of CO2 in the atmosphere. They’ve artificially cooled the past prior to 1960 (about the time Mauna Loa CO2 measurements started) and artificially warmed 1960 to the present.
The result? A steeper warming trend (adding 0.24°C) than what actually exists in the unadjusted data.
It is proof of man-made climate change – created by adjusting the temperature data to fit a premise – that man-made CO2 released into the atmosphere is driving temperature.
But it seems very clear from Dr. Wei Zhang’s analysis that statistical adjustments are the major drivers of temperature increase here.
In my opinion, this is either scientific incompetency or fraud in my view, possibly both. I seldom use the word “fraud” in my criticisms, but when millions of dollars of funding, prestige of being appointed a White House climate advisor is at stake, what else is left? If they are true scientific experts, how does scientific incompetency like this persist for years?