CO2 Data Manipulation
Principia Scientific July 30, 2019
Written by Dr Tim Ball (Climatologist)

The consistent pattern of the IPCC reveals demonization and misrepresentations of CO2. Here are some basic facts about CO2 that illustrate the discrepancy between what the IPCC claim and what science knows.
- Natural levels of Carbon dioxide (CO2) are less than 0.04% of the total atmosphere; it is far from being the most important or even only greenhouse gas as most of the public understands.
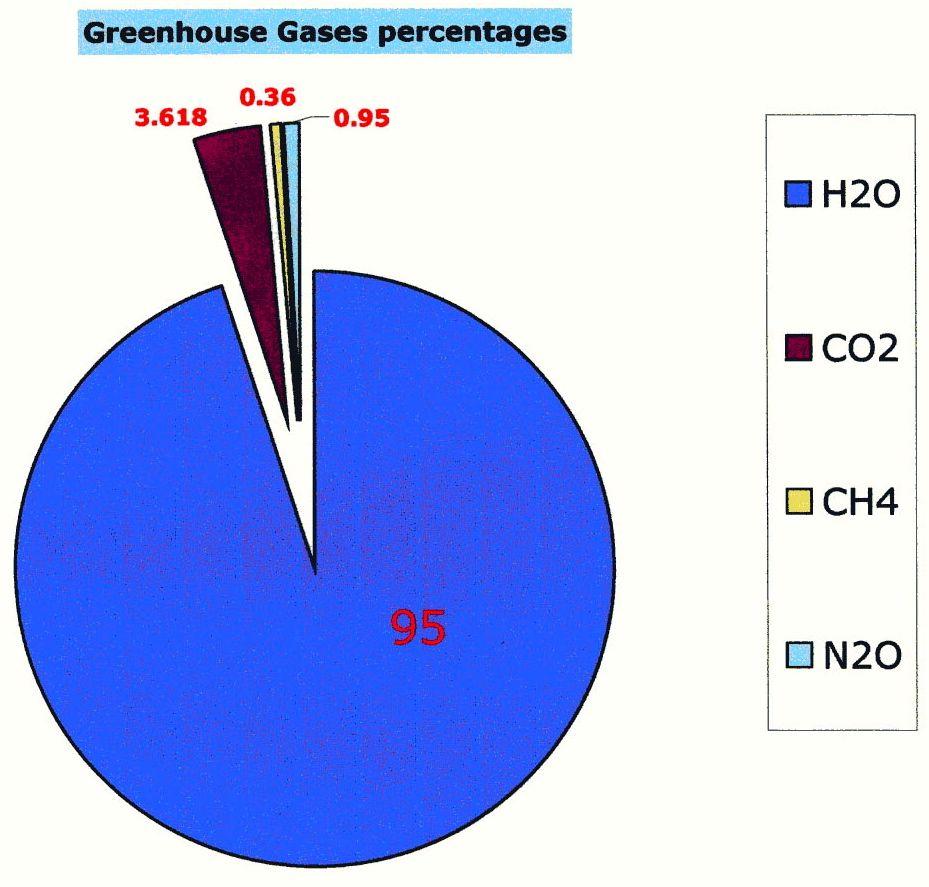
- Water vapour which is 95 percent of the greenhouse gases by volume is by far the most abundant and important greenhouse gas.
- The other natural greenhouse gas of relevance is methane (CH4), but it is only 0.000175 percent of atmospheric gases and 0,036 percent of all greenhouse gases.
- In order to amplify the importance of CO2 they created a measure called “climate sensitivity”. This determines that CO2 is more “effective” as a greenhouse gas than water vapour
- Here is a table from Wikipedia showing estimates of the effectiveness of the various GHGs. Notice the range of estimates, which effectively makes the measures meaningless, unless you have a political agenda. Wikipedia acknowledges “It is not possible to state that a certain gas causes an exact percentage of the greenhouse effect.”

- The result of determining “effectiveness” was the creation of a Global Warming Potential (GWP) chart. It was similar to the chart of Ozone Depleting Substances (ODS) created after the false claim that CFCs were destroying ozone in the upper atmosphere.
- Estimates of the amount of annual human CO2 production added to the atmosphere are produced by the IPCC. They claim it is about 3% of the total added annually.
- In the early IPCC Reports they promoted the idea that the length of time CO2 remains in the atmosphere, known as the Residency Time is at least 100 years. Although the 100 years is not mentioned, the concept is still on or implied on many government web pages. For example, Environment Canada says, “As carbon dioxide stays in the atmosphere for a long time, levels of carbon dioxide continue to build-up in the atmosphere with ongoing human emissions.” Actual Residence Time for CO2 is only 5 to 7 years after which it is cycled back through natural sinks (an area of absorption) such as plants, oceans and soils. (Figure1)
- The ocean is the major control of atmospheric CO2, but its ability varies with water temperature. A cold ocean absorbs more than a warm ocean.
- Humans produce CO2, but they also remove it from the atmosphere. Agriculture and forestry are the major absorbers, removing an estimated 50 percent of total production.
- The Antarctic Ice core record shows temperature increases before CO2. A similar relationship is shown for every single record of any duration and for any time period. Despite this, all computer models are programmed so a CO2 increase causes a temperature increase.
- Carbon dioxide is essential for all life on Earth. Research shows current levels of 392 ppm are approximately one third the optimum for most plants. Empirical evidence from CO2 levels injected into commercial greenhouses indicate optimum yields at levels between 1000 and 1200 ppm. Interestingly this is the average level of the last 300 million years.
The second major data manipulation involved CO2, the target of the entire UNEP and IPCC. How would you “get rid of industrialized nations”as Maurice Strong recommended. The source of their energy and success are fossil fuels. Compare the nation to a car. It’s a good analogy because many demonize the car as the symbol of industrialization, particularly in the US. You can stop the car by shutting off the fuel supply. You can do the same to a nation, but it would bring an immediate negative response. Just look at the reaction when fuel prices soar. You can also stop the car by blocking the exhaust and that had potential for application to a nation. Show that the byproduct of the car, or the nation, is destroying the climate and you have a powerful vehicle to push an agenda to shut down the car or the industry. It is more effective if you get the byproduct labeled a pollutant.
Isolation began with the limiting of the Intergovernmental Panel on Climate Change (IPCC) to only human-caused climate change. The definition of climate change came from the United Nations Environment Program (article 1) of the United Nations Framework Convention on Climate Change (UNFCCC)
“a change of climate which is attributed directly or indirectly to human activity that alters the composition of the global atmosphere and which is in addition to natural climate variability observed over considerable time periods.”
In another of their deceptive changes, they abandoned the original definition of climate change written by the United Nations Framework Convention on Climate Change (UNFCCC) and used in the first three Reports and replaced it in the 2007 Report. Here it is as a footnote in the Summary for Policymakers (SPM). “Climate change in IPCC usage refers to any change in climate over time, whether due to natural variability or as a result of human activity. This usage differs from that in the United Nations Framework Convention on Climate Change, where climate change refers to a change of climate that is attributed directly or indirectly to human activity that alters the composition of the global atmosphere and that is in addition to natural climate variability observed over comparable time periods.” The problem is they did not alter the Fourth Report because Reports are cumulative and so the basis for including natural variability did not exist.
Tables showing factors they considered are evidence that they didn’t change.
Here is the Table for the 2001 Report.
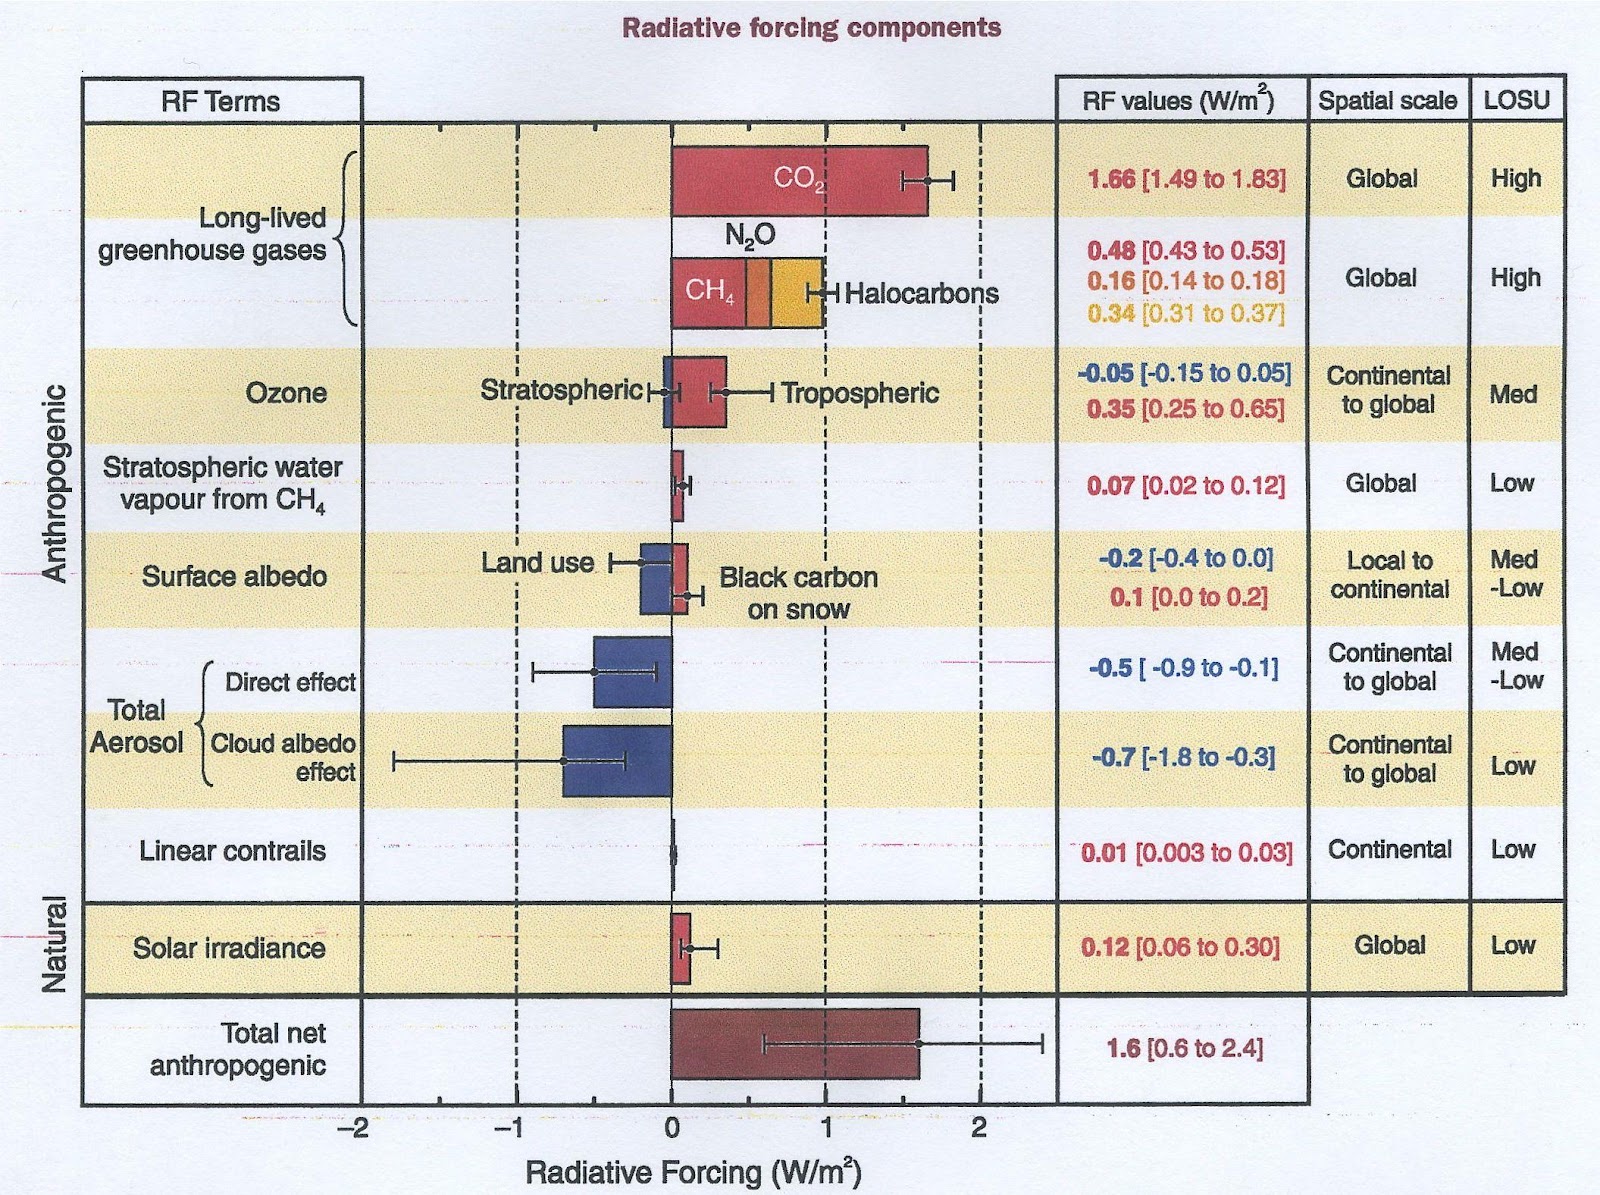
Things to note;
- Water Vapor, the most important greenhouse gas, is not listed.
- Only solar irradiance is included – this is not the only way the Sun affects climate. If you list only human causes then how do we affect solar irradiance?
- The right-hand column is the Level of Scientific Understanding (LOSU).
- Claims of “high” understanding are scientifically unjustified.
- Nine items are listed – only two are high, but four are Low and two Med-Low.
- The total change caused by humans is averaged at 1.6 W/m2 (range 0.6 to 2.4)
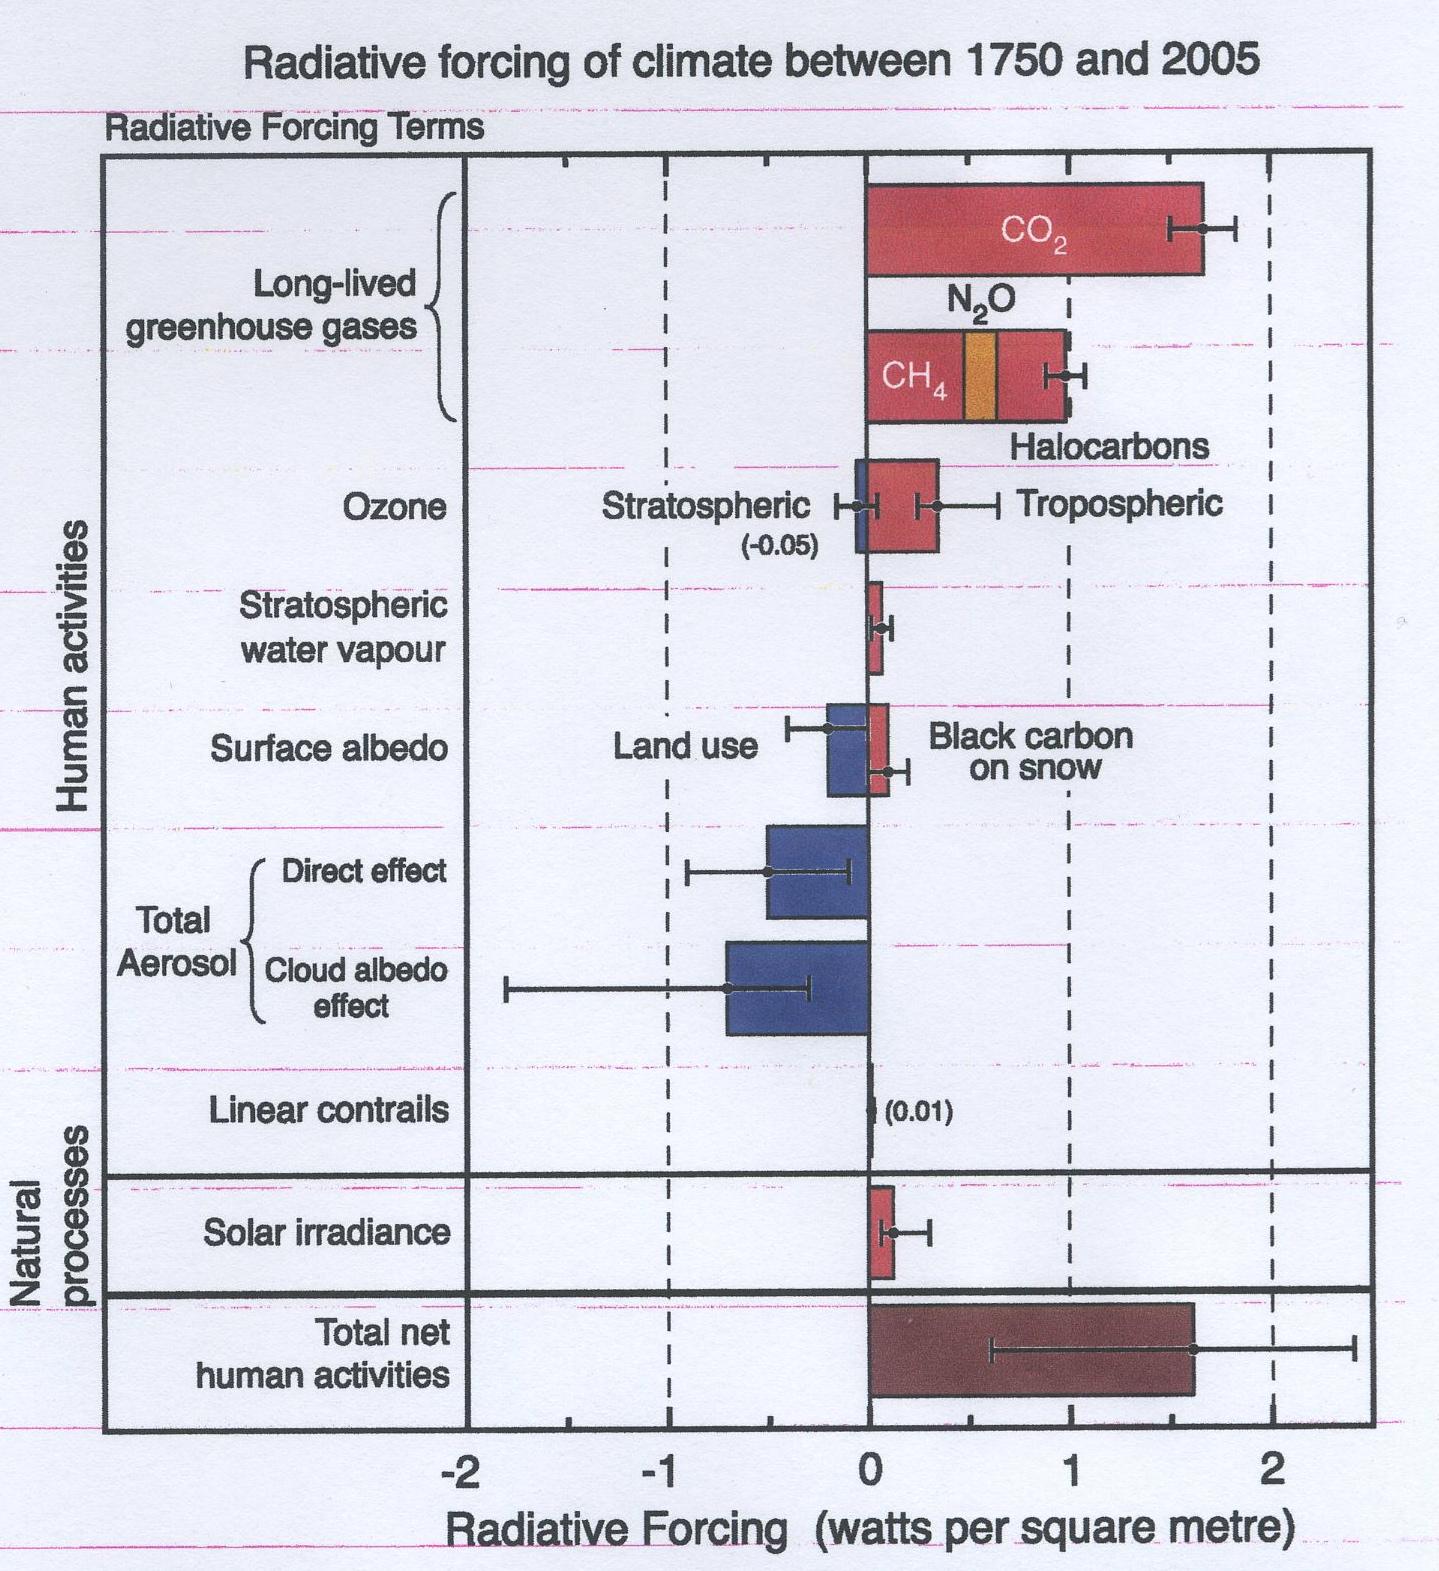
They added no new variables to the 2007 Report, despite the supposed new definition. As with everything the IPCC does it is what is missing or changed that tells the story.
- The LOSU column is gone.
- The column listing the range of estimates of RF (Radiative Forcing) is gone.
- Water Vapor is still missing.
- Numbers for the range of human forcing are missing, but eyeball readings indicate they are unchanged.
- The total net human effect appears to remain at 1.6 W/m2.
- This indicates the claimed increase of human CO2 was not included.
The problem remains that since you don’t know how much CO2 there is or how much it changes naturally, you cannot determine what portion is due to human activities. Every figure used is a very crude estimate at best.
By design all CO2 numbers used by the IPCC underline the human impact. They are meaningless figures from the total volumes to the annual flows and the human inputs as depicted in the IPCC carbon cycle diagram. In 2010 Dr Dietrich Koelle provided a table of the estimated emissions and uptakes of CO2 from natural sources and the human emissions.
EMISSIONS:
Humans and Animals 45 to 52
Oceans’ outgassing (tropical areas) 90 to 100
Volcanic and other ground sources 0.5 to 2
Ground bacteria, rotting and decay 50 to 60*
Forest cutting, forest fires 1 to 3
Anthropogenic emissions (2010) 9.5
TOTAL 196 to 226.5
- other published values: 26 Gt, resp. 86-110 Gt
UPTAKE:
Vegetation on land 55 to 62
Oceans’ uptake 87 to 95*
Algae, phytoplankton, seaweed 48 to 57
Weathering (Silica minerals) 3 to 6
TOTAL 193 to 220
- other published values: 68-110, 30-50 Gt
The difference is + 1.5 to 3 Gt C p.a. which is in agreement with the annual increase (depending on the ENSO activity).
Notice that the range of error of estimates for emissions of Oceans and Ground Bacteria exceeds the total for humans.

Human CO2 production is central to the IPCC objective, so they control production of the information. Like most things they do it is disclosed, but they know few people realize the significance. Here, they explain the process.
—————————————————————–
What is the role of the IPCC in Greenhouse Gas inventories and reporting to the UNFCCC?
A: The IPCC has generated a number of methodology reports on national greenhouse gas inventories with a view to providing internationally acceptable inventory methodologies. The IPCC accepts the responsibility to provide scientific and technical advice on specific questions related to those inventory methods and practices that are contained in these reports, or at the request of the UNFCCC in accordance with established IPCC procedures. The IPCC has set up the Task Force on Inventories (TFI) to run the National Greenhouse Gas Inventory Programme (NGGIP) to produce this methodological advice. Parties to the UNFCCC have agreed to use the IPCC Guidelines in reporting to the convention.
How does the IPCC produce its inventory Guidelines?
Utilising IPCC procedures, nominated experts from around the world draft the reports that are then extensively reviewed twice before approval by the IPCC. This process ensures that the widest possible range of views are incorporated into the documents.
——————————————————————
In other words they control the entire process from the methodology, designation of technical advice, establishment of task forces, guidelines for reporting, nomination of experts to produce the reports, and final approval of what the reports say. They rely on data from individual UN member nations, but any examination of UN data quickly reveals its inadequacies. For example, look at the countries that claim 99% or higher literacy rate.
IPCC figures for annual CO2 production per nation are equally distorted and wrong. Worse, they have no scientific purpose, they are strictly for the political agenda. Professor Murray Salby shows in this video how the human portion is of no consequence. He demonstrates that variation in natural (non-human) sources of CO2 explains almost all annual changes. He shows how just a 5% variation in these sources is more than the total annual human production.
A partial explanation for the IPCC error is because climate science assumes change and variability are abnormal as the diagram illustrates. They don’t show the error in the estimates of volumes, which in at least three instances, atmosphere, oceans, and vegetation/soil detritus exceed estimates for total human production. This is true even with IPCC’s claimed annual increase.
Figure – shows the percentages of greenhouse gases in the atmosphere.
Another diagram shows the greenhouse gas percentages in a different form.
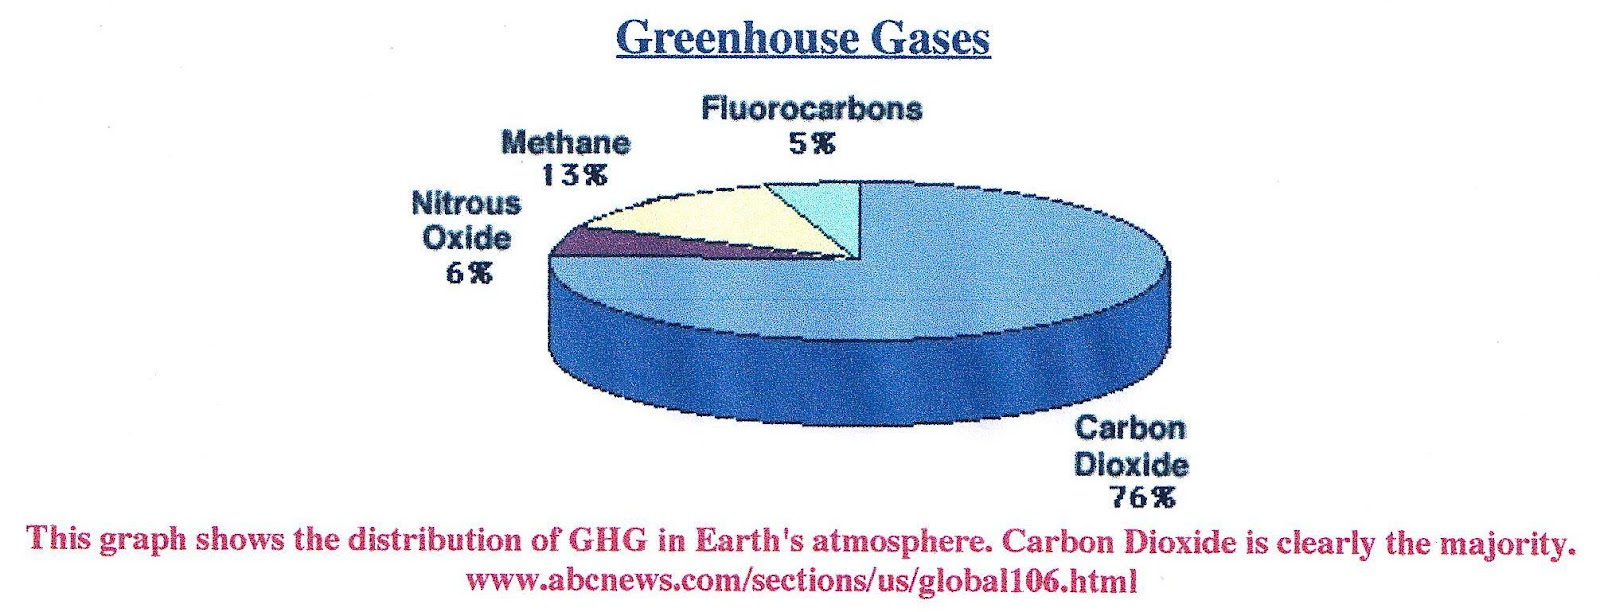
Compare that diagram with this one from the ABC News network web site. It illustrates the distortions created by the deception so the IPCC. Water vapor, the most important greenhouse gas by far, is not even shown. It is evidence of the success in placing all the attention on CO2..
There are several misconceptions about CO2, created to prove the hypothesis and raise the level of threat in various ways. For example, an early IPCC claim said atmospheric residency time of CO2 was at least 100 years. Done, ostensibly, for the political point that even if we stopped CO2 production immediately the damage done lasts for a long time. We now know the actual time residency is approximately 5 to 6 years.
The major assumption of the hypothesis says a CO2 increase causes a temperature increase. After publication in 1999 of Petit et al., Antarctic ice core records appeared as evidence in the 2001 Report.
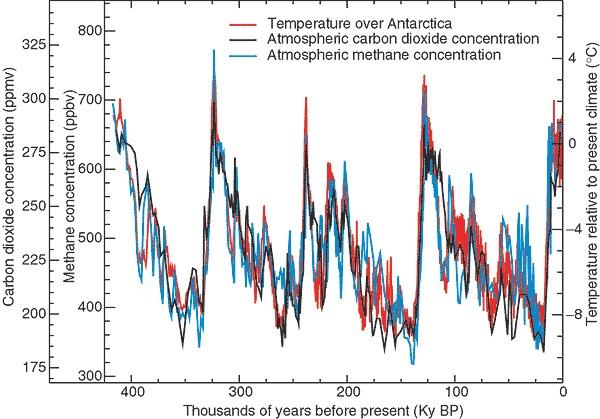
Figure : Antarctic core core record.
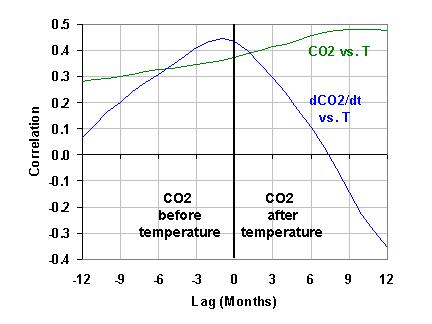
Just four years later proof that the major assumption of the hypothesis was wrong appeared. A more detailed look showed that the temperature increased before CO2 in complete contradiction to the hypothesis. Somehow it was shuffled aside, probably because of the diversionary claim that the lag was between 80 and 800 years. It doesn’t matter because it still contradicts the basic assumption. More compelling is the fact that temperature changes before CO2 change in every record for any period or duration. Most curious, the contradiction is ignored by proponents and too many skeptics. Figure 2 shows a shorter record of the relationship.

Figure 2; Lag time for short record, 1958 to 2009.
It is logical to assume that if CO2 change follows temperature change in every record then CO2 cannot be a greenhouse gas. Despite this, the assumption that a CO2 increase causes a temperature increase is in all global climate computer models including those of the IPCC.
The IPCC faced another serious challenge created by the need to prove their hypothesis, rather than disprove it as normal science requires. It paralleled the need to eliminate the Medieval Warm Period because it showed the world was warmer than today before the Industrial Revolution. It was necessary to show or claim that the pre-industrial level of CO2 was lower than today. This campaign was underway before the ice cores information was released.
Most people think ice cores are the only source of pre-industrial CO2 levels. What most people don’t know is that thousands of direct measures of atmospheric CO2 began in the Nineteenth Century. Joseph Black had studied the properties of CO2 in the 1750s and Joseph Priestly published on oxygen in 1775. Attempts to measure the various volumes of atmospheric gases, with global measures of CO2 followed these events beginning in 1812. Scientists took precise measurements with calibrated instruments as Ernst Beck thoroughly documented.
In a paper submitted to the Hearing before the US Senate Committee on Commerce, Science, and Transportation Professor Zbigniew Jaworowski states
“The basis of most of the IPCC conclusions on anthropogenic causes and on projections of climatic change is the assumption of low level of CO2 in the pre-industrial atmosphere. This assumption, based on glaciological studies, is false.”
Of equal importance Jaworowski states,
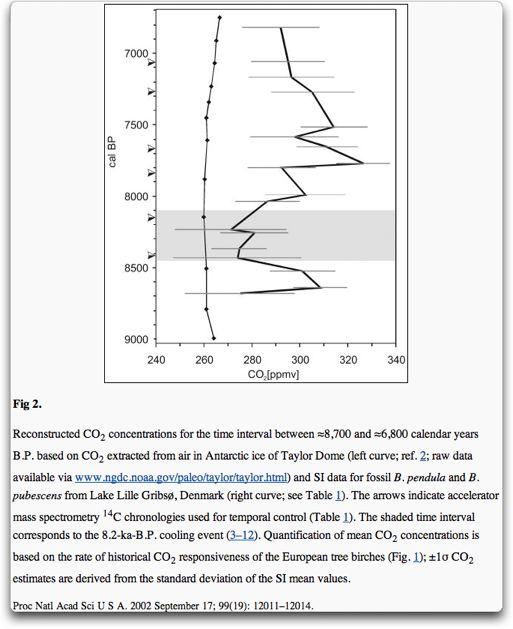
The notion of low pre-industrial CO2 atmospheric level, based on such poor knowledge, became a widely accepted Holy Grail of climate warming models. The modelers ignored the evidence from direct measurements of CO2 in atmospheric air indicating that in 19th century its average concentration was 335 ppmv[11] (Figure 2). In Figure 2 encircled values show a biased selection of data used to demonstrate that in 19th century atmosphere the CO2 level was 292 ppmv[12]. A study of stomatal frequency in fossil leaves from Holocene lake deposits in Denmark, showing that 9400 years ago CO2 atmospheric level was 333 ppmv, and 9600 years ago 348 ppmv, falsify the concept of stabilized and low CO2 air concentration until the advent of industrial revolution [13].
Jaworowski’s claim the modelers ignored the 19th century readings isn’t correct. They knew about it because T.R.Wigley introduced information about the 19th century readings to the climate science community. (Wigley, T.M.L., 1983 “The pre-industrial carbon dioxide level.” Climatic Change 5, 315-320). It did what many others have done in taking a wide range of readings, eliminating only high readings and claiming the pre-industrial level was approximately 270 ppm. I suggest this is what influenced the modelers because Wigley was working with them through the Climatic Research Unit (CRU) at East Anglia. He was the key person directing the machinations as revealed by the leaked emails from the Climatic Research Unit (CRU).
Wigley was not the first to misuse the 19th century data, but he did reintroduce it to the climate community. Guy Stewart Callendar, a British Steam engineer, pushed the thesis that increasing CO2 was causing warming. He did what Wigley did by selecting only those readings that supported the hypothesis.
There are 90,000 samples from the 19th century and the graph shows those carefully selected by G. S. Callendar to achieve his estimate. It is clear he chose only low readings.
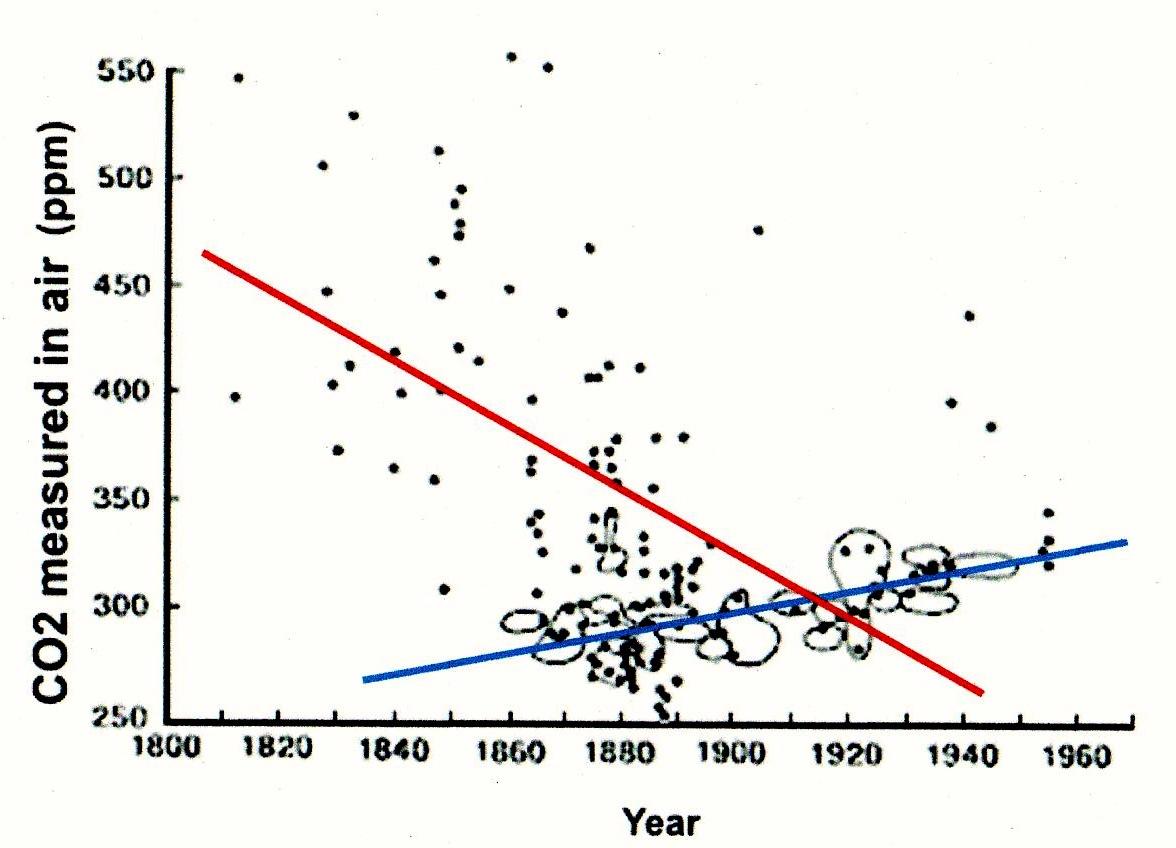
You can see changes that occur in the slope and trend by the selected data compared to the entire record.
Ernst-Georg Beck confirmed Jaworowski’s research. An article in Energy and Environment examined the readings in great detail and validated their findings. In a devastating conclusion Beck states
Modern greenhouse hypothesis is based on the work of G.S. Callendar and C.D. Keeling, following S. Arrhenius, as latterly popularized by the IPCC. Review of available literature raise the question if these authors have systematically discarded a large number of valid technical papers and older atmospheric CO2 determinations because they did not fit their hypothesis? Obviously they use only a few carefully selected values from the older literature, invariably choosing results that are consistent with the hypothesis of an induced rise of CO2 in air caused by the burning of fossil fuel.
So the pre-industrial level is some 50 ppm higher than the level put into the computer models that produce all future climate predictions. The models also incorrectly assume uniform atmospheric global distribution and virtually no variability of CO2 from year to year.
Beck found, “Since 1812, the CO2 concentration in northern hemispheric air has fluctuated exhibiting three high level maxima around 1825, 1857 and 1942 the latter showing more than 400 ppm.” Here is a plot from Beck comparing 19th century readings with ice core and Mauna Loa data.

Variability is extremely important because the ice core record shows an excceptionally smooth curve achieved by applying a long term 70 year smoothing average. Smoothing applies to the Mauna Loa and all current atmospheric readings, which can vary up to 600 ppm in the course of a day as the Mauna Loa portion of the curve in the diagram shows. Smoothing done on the scale of the ice core record eliminates a great deal of information. It is why statistican William Brigg’s says you never, ever, smooth a time-series. Elimination of high readings prior to the smoothing makes the loss even greater. Beck explains how Charles Keeling established the Mauna Loa readings by using the lowest readings of the afternoon. He also ignored natural sources a practice that continues. Beck presumes Keeling decided to avoid these low level natural sources by establishing the station at 4000 m up the volcano. As Beck notes “Mauna Loa does not represent the typical atmospheric CO2 on different global locations but is typical only for this volcano at a maritime location in about 4000 m altitude at that latitude.(Beck, 2008, “50 Years of Continuous Measurement of CO2 on Mauna Loa” Energy and Environment, Vol 19, No.7.)
Keeling’s son continues to operate the Mauna Loa facility and as Beck notes, “owns the global monopoly of calibration of all CO2measurements. Since the young Keeling is a co-author of the IPCC reports, they accept the version that Mauna Loa is representative of global readings and that they reflect an increase since pre-industrial levels.
The Historic CO2 Record.
Al Gore and others created the delusion that CO2 levels are at an all time high. Here is a plot of CO2 levels for 600 million years using geologic evidence. It shows the current level is the lowest in the entire record and only equaled by a period between 315 and 270 million years ago. For the last 300 million years, the average is between 1000 and 1200 ppm. For most of the record, the levels were above 1000 ppm and as high as 7000 ppm.

There are other problems with the ice core record. It takes years for air to be trapped in the ice, so what is actually trapped and measured? Meltwater moving through the ice especially when the ice is close to the surface can contaminate the bubble. Bacteria form in the ice, releasing gases even in 500,000-year-old ice at considerable depth. (“Detection, Recovery, Isolation and Characterization of Bacteria in Glacial Ice and Lake Vostok Accretion Ice.” Brent C. Christner, 2002 Dissertation. Ohio State University). Pressure of overlying ice, causes a change below 50m and from brittle ice becomes plastic and begins to flow. The layers formed with each year of snowfall gradually disappear with increasing compression. It requires a considerable depth of ice over a long period to obtain a single reading at depth. Jaworowski also identifies the problems with contamination and losses during drilling and core recovery process.
Another measurement of CO2 provides further evidence of the effects of smoothing and the artificially low readings of the ice cores. Stomata are the small openings on leaves, which vary directly with the amount of atmospheric CO2. A comparison of a stomata record with the ice core record for a 2000-year period illustrates the issue. Stomata are like the direct atmospheric measures discussed by Beck, but unlike the trapped bubbles in the ice core, which take decades to form.
Stomata data show the higher readings and variability when compared to the excessively smoothed ice core record and align quantitatively with the 19th century measurements as Jaworowski and Beck assert. The average level for the ice core 2000-year record shown is approximately 265 ppm while it is at least 300 ppm for the stomata record.
The pre-industrial CO2 level are marginally lower than current levels and likely within the error factor. Neither they, nor the present readings, are high relatively to the geologic record. The entire output of computer climate models begins with the assumption that pre-industrial levels were measurably lower. Elimination of this assumption further undermines the claim that the warming in the industrial era period was due to human addition of CO2 to the atmosphere. Combine this with their assumption that CO2 causes temperature increase, when all records show the opposite, it is not surprising IPCC predictions of temperature increase are consistently wrong.
This is crucial because most don’t realize the IPCC link scientific model outputs with economic model outputs to create the Special Report on Emissions Scenarios (SRES). Many severely criticized them including participant David Henderson who said, “My main theme is what I see as the uncritical and over-presumptive way in which these various sources have dealt with the scientific aspects of the subject.”They’re circular arguments that predetermine results, which explains why they’re always wrong.
IPCC has three Working Groups (WG). WGI proves CO2 is the cause. WGII uses that result to determine the impact. WGIII recommends remedial actions. All assume CO2 will increase because of development. Five specific directions are controlled by the first.
Five criteria that should be met by climate scenarios if they are to be useful for impact researchers and policy makers are suggested: Criterion 1: Consistency with global projections. They should be consistent with a broad range of global warming projections based on increased concentrations of greenhouse gases. This range is variously cited as 1.4°C to 5.8°C by 2100, or 1.5°C to 4.5°C for a doubling of atmospheric CO2 concentration (otherwise known as the “equilibrium climate sensitivity”). Four other Criteria were advisory. Climate sensitivity is a problem for the IPCC and central to the skeptical challenge.
The IPCC assumes, incorrectly, that a CO2 increase causes a temperature increase. Even if it is true, they face a problem because there is an upper limit to the temperature increase, even with doubled or tripled CO2. By their measures, at current levels of CO2 saturate the atmosphere with regard to its ability cause temperature increase. Any further increase will have very little effect. Think about it like trying to stop light coming through a window. A coat of black paint will stop light passing through a window – say 97%. A second coat can only reduce the light fractionally and further coats even less.
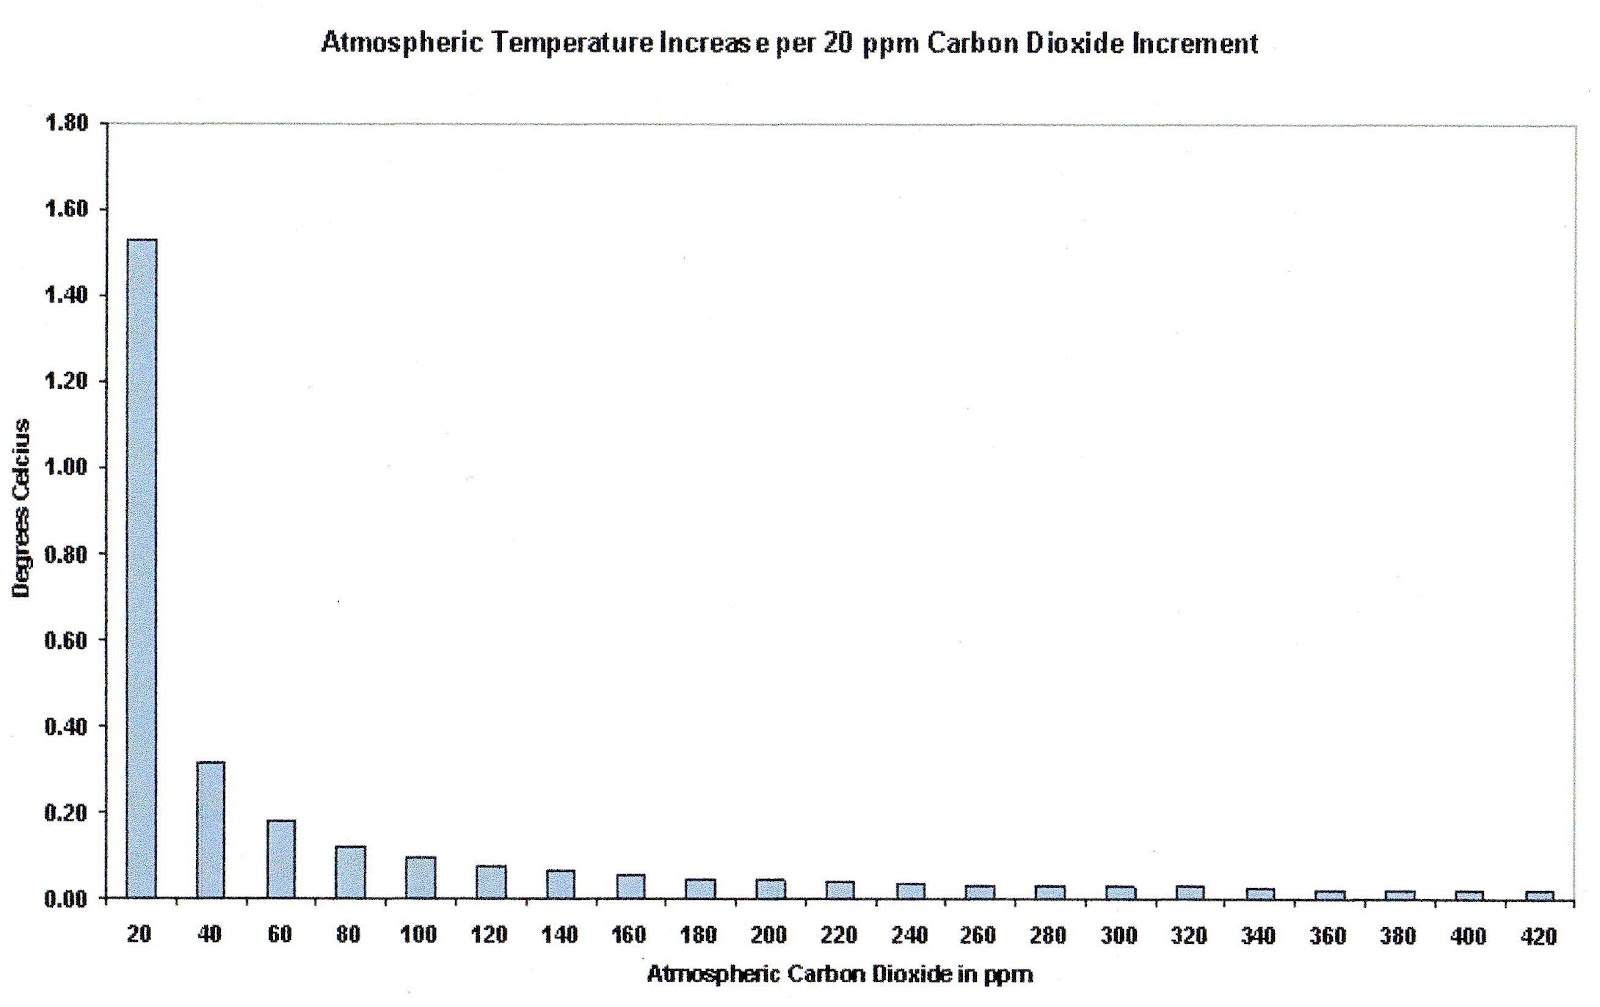
Source: Willis Eschenbach
The IPCC created a positive feedback to overcome the problem. This said that CO2 causes temperature increase that causes increased evaporation. This water vapour acting as a greenhouse gas propels the temperature trend upwards.
Lindzen and Choi, discredited this in their 2011 paper which concluded “The results imply that the models are exaggerating climate sensitivity.” Earlier Roy Spencer had challenged the issue. The level is reduced every time the sensitivity issue is revisited. Eventually, they will realize that the value for CO2 is zero and possibly negative because CO2 is an atmospheric cooling agent.
This goes to the heart of the entire Greenhouse Effect (GHE) fiasco and the demonizing of CO2. Joe Postma sets out the problems with the original GHE physics created by members of the IPCC.
He explains
“I look at the standard atmospheric greenhouse schematic and energy budget from climate science, see that it has a flat Earth and that sunshine is cold, and so I ask, “What difference does it make if you treat sunshine as hot, its real strength, and the Earth as a rotating sphere?”.
He set out the fundamental problems in an article Copernicus Meets the Greenhouse Effect”.
It is a more logical conclusion, based on the facts and evidence. In every record of any duration for any period temperature increases before CO2. The IPCC deception is exposed. They wanted to prove human CO2 was causing global warming as part of their belief that industrialized populations would exhaust all resources and had to be shut down.
Their only objective determined to show human production steadily, inexorably increasing. Their calculations predetermine that, because human CO2 production is directly linked to population increase. A population increase guarantees a CO2 increase.
It is another of their circular arguments with no basis in science. Now the politicians must deal with facts and abandon all policies based on the claims that CO2 is causing climate change.