We’ve made it to mid-July and we are just now having our first major heat wave of the season here in the United States.
A massive ridge of high pressure has built in over the southeast, which is dominating weather conditions almost everywhere east of the Rockies (Figure 1).¹
 |
| Figure 1. NOAA NWS surface analysis for July 19, 2019. |
The National Weather Service has issued Heat Advisories, Excessive Heat Watches, and Excessive Heat Warnings, from Nebraska to New Jersey as temperatures soar well into the 90s (scattered 100s are possible too) through Sunday (Figure 2).
 |
| Figure 2. Weather alerts for Friday, July 19. |
When high pressure systems like this move over an area, air is pulled down towards the surface whereby it’s compressed, increasing the temperature.²
The longer the “heat dome” remains over an area, the temperature generally becomes hotter with each passing day until the high either moves away or weakens.² This is because there is little mixing of air which would otherwise prevent heat accumulation at the surface.
The large amount of sinking motion prevents low pressure systems from moving into areas dominated by high pressure while also inhibiting convection and cloud development in much of the area dominated by high pressure.² As a result, the ground becomes dry due to a lack of precipitation, which can enhance the temperature. The air can also become dry, unless water vapor is trapped underneath the “heat dome,” like it is currently. This excess water vapor in and of itself causes other issues like the heat index to soar well into the 100s.
Due to a lack of clouds, the sunlight can feel penalizing.² This buildup of heat at the surface is known as a “heat wave,” and they generally last anywhere from three to seven days, although some last longer.
Heat waves like this are typical of summer and from personal forecasting experience, they generally occur two to three times per year. This natural process used to be called “weather,” but in 2019, like everything that goes wrong, it’s climate change.
Unlike more recent weather or weather-related events, heat waves are actually not new to being blamed on global warming. However, the amount of heat wave hysteria among the public has increased significantly in recent years.
It is in this writing that I have three simple and valid points that destroy the hype on heat waves, like the current one.
Reason #1: Equal, But Opposite
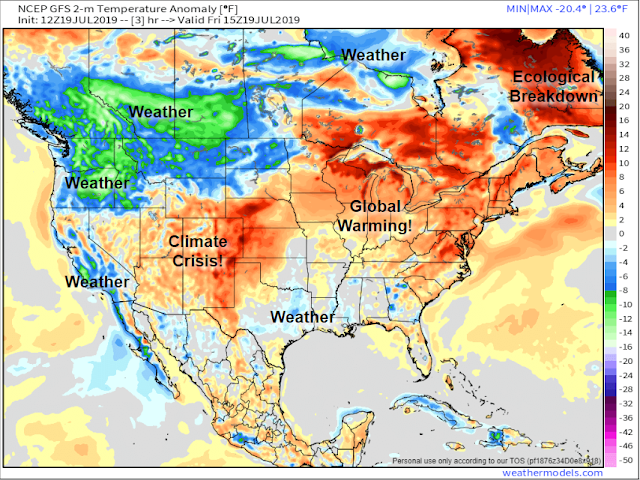
While everyone is fixated on the heat wave, they ignore the unusual cold that’s nearby (Figure 3). As all weather forecasters should know, “for every action, there’s an equal and opposite reaction.” In other words, for every place that there’s warm anomalies, there are places with cool anomalies; it’s nature’s balancing act.
 |
| Figure 3. GFS 2-meter temperature anomalies for the U.S. on Friday July 19, 2019. – weathermodels.com. |
Climate activists seem to ignore the fact that nature tries to find a balance. If they took note of equilibrium, they wouldn’t be fretting over this heat wave, simply because there’s reasonably cool temperatures relative to average out west to balance it all out in the total picture.
Another thing that really annoys me with these people is that they get anxious because the weather is not “normal,” and by normal they mean climatologically “normal.”
Most people, even those who aren’t fascinated by the weather like me, understand that “normal” weather rarely happens. It’s usually one extreme or the other; hot or cold, warm or cool. These extremes for a single location for a single day end up averaging out numerically for a daily average over the course of 30 years. It’s highly unlikely that a daily temperature average of the high and low are going to stack up near the 30-year normal. It just doesn’t happen.
Figure 3 above shows the 2-meter temperature anomalies for Friday, July 19. Figure 4 below shows the same thing, but I adjusted the contrast of the image in order to separate the most extreme color differences, or in this case, the temperatures based on the color key to the right.
It’s time for a vision test.
It looks like to me that there’s pretty much an equal balance between extreme heat and extreme cold relative to average on the map (warmth dominates slightly with positive anomalies east of Hudson Bay), so nobody can reasonably make the argument that the warmth outweighs the cold.
 |
| Figure 4. GFS 2-meter temperature anomalies for the U.S. on Friday, July 19, 2019 (contrast adjusted). – weathermodels.com. |
Reason #2: Some Historical Perspective
Most people are just too lazy to do a little bit of research. It’s a simple cold, hard fact. And for this, they believe everything they hear from journalists and politicians, both of which aren’t trained as scientists. This is quite dumbfounding considering we have the internet right at our fingertips.
According to the
Fourth U.S. National Climate Assessment, the average duration of warm spells (heat waves) has declined from around eleven days during the 1930s to 6.5 days during the 2000s (Figure 5).³ In other words, the average duration of heat waves have declined by nearly 41% since the 1930s.
 |
| Figure 5. Warm spell duration. – U.S. Fourth National Climate Assessment. |
In addition, the average maximum temperature during any given heat wave has also declined in the U.S. from 101°F in the 1930s to 99°F since the 1980s (Figure 6).³
 |
| Figure 6. Average warmest temperature each year. – U.S. Fourth National Climate Assessment. |
The 1930s remains the warmest decade in U.S. history. It also had some of the hottest summers that the country has ever seen since records began.
The map below (Figure 7) shows the decade in which each U.S. state (also includes Guam, Puerto Rico, the U.S. Virgin Islands, and Washington, D.C.) initially set their current hottest temperature in the record books, and as you can see, there’s an overwhelming number that are colored dark red (almost brown), which indicate the 1930s.⁴
 |
| Figure 7. Decade in which each U.S. state and territory initially recorded its hottest temperature. |
In fact, 19 (38%) of the 50 U.S. states (I realize Alaska and Hawaii weren’t states until 1959) initially recorded their (current standing) hottest temperatures in the 1930s. 22 states (44%) either set or tied their hottest temperatures in the 1930s (Figure 8).
 |
| Figure 8. Each U.S. state that set or tied its hottest temperature in the 1930s. |
If we had heat like that of the 1930s (click
this link to see U.S. heat extremes), people would be screaming “climate doomsday” at ten times the levels they are currently!
Reason #3: Weather ≠ Climate
With most climate activists - especially those who are not trained or degreed scientists - it’s “do as I say, not as I do.”
They get triggered if a skeptic uses a record low temperature or record snowfall as proof that global warming is a hoax, and claim “weather and climate are not the same,” or that “climate is global, weather is not,” then turn around and use a single localized heat wave as evidence of a “climate catastrophe.”
In conclusion…
Using single weather events as evidence that global warming is either a hoax or is a crisis is completely dishonest and two-faced. I have seen too many certain people do it for both reasons, and its usually to try to pass legislation.
In other words, this entire movement has become a political thing and not one about science. It’s clear as day, and if you can’t see that, then you’re on your own.
In the end, the truth shall set you free.
REFERENCES


