
Rebuttal and corrections to Dr. Roy Spencer’s analysis and comments regarding the Pinatubo Study
Bud Bromley & Tomer Tamarkin
April 16, 2023
Dr. Roy Spencer is mistaken on all of the points in his review and posts concerning the ClimateCite-Bromley-Tamarkin-Menahem Pinatubo Study report and associated collateral materials.
Our main Pinatubo study is not about the CO2 emissions from Pinatubo, as Tom Tamarkin has correctly instructed Roy numerous times over the course of the last year. . There was no reason or interest to attempt to quantify the CO2 emitted from Pinatubo. Others have estimated and reported that CO2 release. But more importantly, the perturbation to CO2 trend following the eruption which we studied was the increased removal of CO2 followed by a faster and larger replacement of that CO2, not the CO2 emissions from Pinatubo.
The point we are making is that during the two-year period following the Pinatubo eruption, the rate of CO2 removal from the atmosphere exceeds the sum of:
- The rate of human CO2 emissions during the period (during which time there is no reason nor report indicating human CO2 emissions slowed or stopped, but rather increased.)
- The usually higher rate CO2 emissions from ocean resulting from an El Nino event, one of which began during the post-eruption 2 years.
- The rate of the cyclical saw tooth pattern, the seasonal cyclical rate increase and decrease in CO2 concentration generally attributed to seasonal photosynthesis differences between northern and southern hemispheres.
- The rate of CO2 emitted by Pinatubo itself, whatever the relatively minor amount and rate.
- The rate of all other natural CO2 emissions from the biosphere, e.g. rotting, emissions from sea surface, etc.
Then following two years of relatively rapid, consistent reduction in the rate of increase of CO2, there is a more rapid replacement of CO2 over the next 2 years amounting to more CO2 than was removed. In 1996, CO2 ppm/yr is about where it would be expected to be if the deceleration had not occurred.
How do we know that? We know because the ppm/yr in the CO2 concentration slows for more than 2 years, as we reported. Our Pinatubo paper analyzed the NOAA-Mauna Loa-measured CO2 concentration rate of change (ppm/yr) using daily measurements. We did that because CO2 ppm/yr observed in the average annual NOAA data declines in 1991, 1992, and 1993. The eruption was June, 1991. By inference, there is a very large and very rapid sink and source which are not yet part of orthodox climatology.
In northern hemisphere (NH) winter photosynthesis is very low to negative. CO2 absorption by plant life is minimal. CO2 emissions from rotting plant life exceeds absorption over large land areas. There is more planted land area in NH than in SH. This results in the cyclical saw tooth pattern observed in the Keeling curve. The cyclical saw tooth pattern is observed in our data also. But in both our processed data and in the NOAA raw daily data the rate of increase slows visibly and significantly, as we reported.
However, by analyzing NOAA’s daily data to obtain higher resolution with no averaging of averages, there is a negative trend in ppm/yr that extends over more than two-years following the June 1991 eruption. That is, in more than 2 complete seasonal saw tooth photosynthesis cycles both the highs and the lows are consistently lower, reaching zero ppm/yr momentarily. Where is that reported elsewhere?
A very large amount of CO2 was removed from the atmosphere very rapidly. The rate cannot be explained by increased CO2 absorption due to increased photosynthesis. The consistently negative rate of change of ppm/yr (i.e., second derivative) occurring for more than 2 years are not explained by increased photosynthesis due to light scattering and diffusion.

If Roy Spencer can reference other papers which discuss the time derivatives of CO2 concentration approaching or momentarily reaching zero during the two years following the Pinatubo eruption, then I would appreciate reading those papers. In fact, our paper provided references reporting the decline in the slope of net global CO2 concentration following the eruption, including for example the large graph below and its full NOAA reference. There is no way Dr. Spencer could have missed this, that is, if he read the paper. Our paper also provided other references, as Tom wrote.

Second, also observed is a very large and rapid recovery in CO2 ppm/yr which follows the 2-year period of slowing of the ppm/yr. Our scientists calculated the date of maximum deceleration as April 22, 1993. The date of maximum acceleration is December 15, 1993. Acceleration continues another 2 years until 1996. This 2+ year recovery is steeper/faster than was the decline. This fact is consistent and expected based on the physical chemistry of slower rate of absorption of CO2 into sea surface versus rate of emission of CO2 from sea surface to air. According to NOAA’s annual record of ppm/yr, the 10 year ppm/yr spanning 1990-2000 was lower than the previous 10 years. However, this non-equilateral deceleration vs recovery acceleration is inconsistent with Spencer’s promoted theory based on photosynthesis. Clouds, aerosols ringing earth’s equator and extending into the stratosphere dissipated slowly. Light diffusion and scattering would therefore dissipate slowly. But the data show the CO2 ppm/yr rate recovered more rapidly than it had declined.
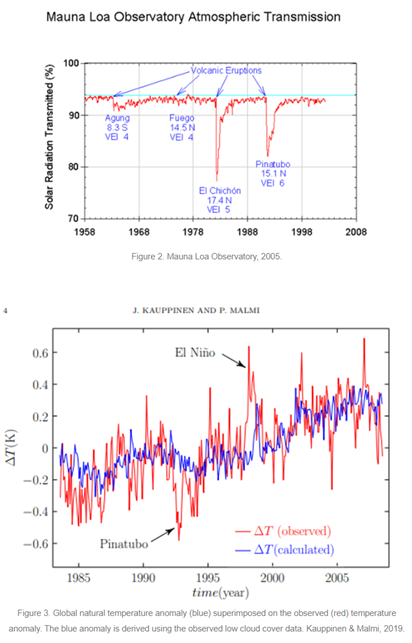
Third, there is a fundamental physics problem with Dr. Spencer’s promoted photosynthesis theory. Yes, visible light diffusion and scattering within forests and fields has been shown to increase photosynthesis. However, in this Pinatubo eruption, the diffusion and scattering occurred in the stratosphere, miles above forests and fields. At each light scattering event in the stratosphere and millions more scatterings sequentially in the troposphere before the light finally reaches plants on the surface, in each event the amplitude (watts) of the light is reduced. Visible light is also absorbed and reflected by the gases, aerosols and particulates in the high altitude ring. What occurred was not a mist or fog or aerosols within the forest, which would have the effect of increasing plant surface area receiving available wattage. However, due to the high-altitude clouds, etc. following the eruption, the watts of visible insolation was reduced by scattering, absorption and reflection before it reached the surface. The reduction in insolation wattage is confirmed by the sharply reduced solar transmission spectra produced by the NOAA Mauna Loa Observatory and also by the widely reported negative global temperature anomaly following the eruption including the paper by Kaupinen & Malmi (2019), both NOAA and Kaupinen & Malmi (2019) are referenced in our paper including these 2 graphs below. In other papers which we did not reference, following the eruption, stratosphere temperature increased while surface and troposphere temperature decreased, all evidence which is consistent with fewer watts insolation at the surface for photosynthesis.
Obviously, booth lower watts solar insolation at the surface and cooler surface temperatures are not consistent with a higher rate of photosynthesis.
What occurred is consistent with Henry’s Law, Graham’s Law, Fick’s Law, the Law of Mass Action, and Le Chatelier’s Principle. What occurred is not consistent with increased photosynthesis caused by visible light scattering and diffusion in the stratosphere.