By Jim Steele | July 12, 2021
For those who truly want to be guided by science, put aside the climate crisis hysteria. We can explain the natural dynamics of all heat waves by simply knowing 1) how heat is transported along the earth’s surface; 2) how heat is transported vertically; 3) how solar heating changes; and 4) how the greenhouse effect varies.
Below is a map of global temperature anomalies for the year 2014 that illustrates natural climate dynamics. There is no uniform warming that might be expected from a global blanket of greenhouse gases. Across the globe, surface temperatures alternate between regions of above average warmth (red) with regions of below average (blue). (Gray regions lack sufficient data). Indeed, the observed cooler eastern USA is dubbed a “warming hole” by climate scientists because its cooling trend contradicts global warming theory. It requires a natural climate dynamic explanation.

The temperature pattern is associated with regions where warmer air from the south more frequently intruded northward, while simultaneously, cold air from the north intruded southward. This pattern is due to a naturally wavy jet stream and associated pressure systems. The warm red regions indicate regions where high‑pressure systems dominate. In the northern hemisphere, high pressure systems cause clockwise atmospheric circulation that pulls warm air northward on its western side, and cold air southward on its eastern side. Low pressure systems circulate counter-clockwise, conversely pulling cold air southward on its western side. These combined circulation patterns partly explain both the extreme cold that dropped Texas temperatures as much as 50° F below average in February 2021, as well as extreme heating that raised USA’s northwest temperatures 30°- 40° F above normal the following June. Similarly in 2019, northward transport of heated air from the Sahara desert caused heat waves over Europe and Greenland. Such natural heat transport can also cause coastal Alaska to be warmer than Florida.
Below is an illustration of how high and low‑pressure systems also cause opposite patterns of vertical air circulation, as in the natural Madden‑Julian Oscillation. Low pressure systems are regions of upward rising air. As the air rises, water vapor condenses to form clouds. Although the clouds increase the greenhouse effect, clouds reduce solar heating to a greater degree. The net effect causes cooler surface temperatures. To balance the weight of rising air, the air must sink elsewhere, causing a high‑pressure system. However, that sinking air is now almost devoid of water vapor. The resulting clear skies reduce greenhouse effect, allowing more infrared heat to escape, but also increases solar heating. Because increased solar heating is greater, the net effect is warmer surface temperatures.
High‑pressure systems often cause heat waves due to how heat is transported, their associated clear skies and increased solar heating. The eastward moving Madden‑Julian Oscillation, as well as El Nino and La Nina events along with other oscillations, can unexpectedly interact to amplify regions of sinking air and thus determine the location of a high‑pressure system and heat wave.

Finally, vertical air motion adds another warming dynamic. The gas laws are unequivocally proven physics and state that by simply increasing pressure, air temperature will increase without any added energy (aka adiabatic warming). Thus, the increasing weight of the atmosphere on sinking dry air warms that air by 5.4°F for every 1000 ft it descends. In addition to surface wind transport, this dynamic contributed to record heat on the northern tip of the Antarctic peninsula where air was descending from the mountains. Along the west coast of the United States, air pushed from the Sierra Nevada to the ocean coast (aka the Santa Ana and Diablo winds) causes California to experience unusually warm temperatures (and larger fires) during the winter. A similar descending flow of air from the Cascade mountains, contributed to the June 2021 extreme heat wave in Washington and Oregon.
Even when descending air doesn’t reach the surface, it also warms the surface by suppressing convection. Air contacting the earth’s solar heated surface warms and rises (aka convection). However, air only rises if its warmer than the surrounding atmosphere. Descending air from several thousand feet in altitude warms as it falls. Yet despite that warming air only reaching 100 feet above the ground, it suppresses convection that normally carries heat from the surface to the upper troposphere. The effect is like the extreme warming of a car’s interior when rolled up windows prevent heated air from leaving.
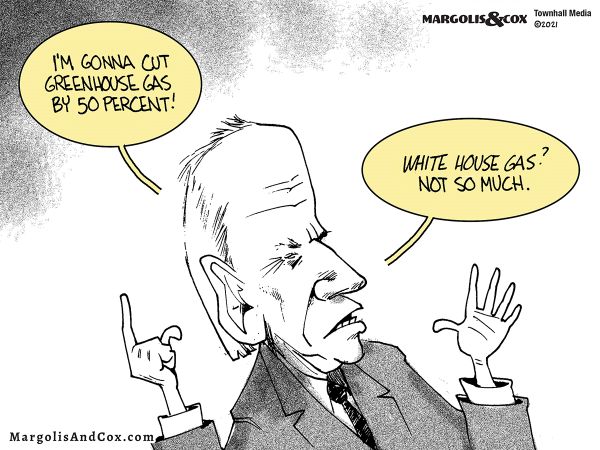
The world’s expert on northwestern USA’s weather, Cliff Mass, has presented evidence showing the 2021 heat wave was a “black swan event” where all the natural dynamics discussed above converged. As illustrated by global warm and cold anomalies below, the northwest heat wave was a uniquely local event. Yet to support his agenda, President Biden has fear-mongered the Northwest heat wave as a global climate crisis. Biden doesn’t know science and would look foolish in a climate debate. Disturbingly, some scientists dependent on global warming funding also suggest only global warming explains that heatwave. However, they ignore the fact that the heatwave’s clear skies reduce the local greenhouse effect driven by water vapor. Additionally, global warming can’t explain cold events such as Europe’s record cold just 2 months earlier. So, beware! The media is promoting misinformation. Only natural climate dynamics scientifically explain recent extreme weather events.


