The warming effects of CO2 by the IPCC cannot be fitted into the GH effect
By Antero Ollila
March 9, 2020
I have shown that the greenhouse (GH) effect definition of the IPCC and also used by climate researchers violates the physical laws. The GH effect depends on the downward radiation from the atmosphere encompassing three energy sources. Latent heating from the physical state change from gas to liquid and partly even to solid-state, sensible heating by convection, and LW absorption by changing infrared radiation into heat. All these energy fluxes originate from the Earth’s surface, they warm up the atmospheric material which then radiates LW radiation according to its temperature back to the surface and this is the GH effect. The correct calculation basis is therefore 270 Wm-2 and not only the LW absorption of 155 Wm-2. The contribution of CO2 is only 7.4% (2.5°C) by the concentration of 400 ppm.
The correct GH effect magnitude does not only mutilate the image of carbon dioxide as a strong GH gas, but it has further consequences in the climate models. I have analyzed in the earlier studies that simple climate models (introduced by the IPCC) gives the same global warming values as most complicated computer models. Simple models can be used for calculating the global temperature effect of increased CO2 concentration up to the concentration of 1370 ppm
dT = λ * k * ln(C/280) (1)
where dT is the global surface temperature change (K) starting from the year 1750, λ is the climate sensitivity parameter (K/(Wm-2) being 0.5 in the IPCC model assuming positive water feedback, and 0.27 in my model (called here the Ollila model) and k is a parameter being 5.35 in the IPCC model and 3.12 in the Ollila model. These IPCC model parameters give Transient Climate Sensitivity (TCS) values of 1.8°C for the IPCC model, and 0.6°C value for the Ollila model.
The IPCC has reported that the TCS value is 1.2°C if there are no feedbacks included (= CO2 warming effects only) and it means λ value of 0.324. These two curves have been depicted in Fig. 1. CO2 warming impact curves have been adapted to give a total warming value of 2.5 ⁰C caused by the CO2 concentration of 400.9 ppm.
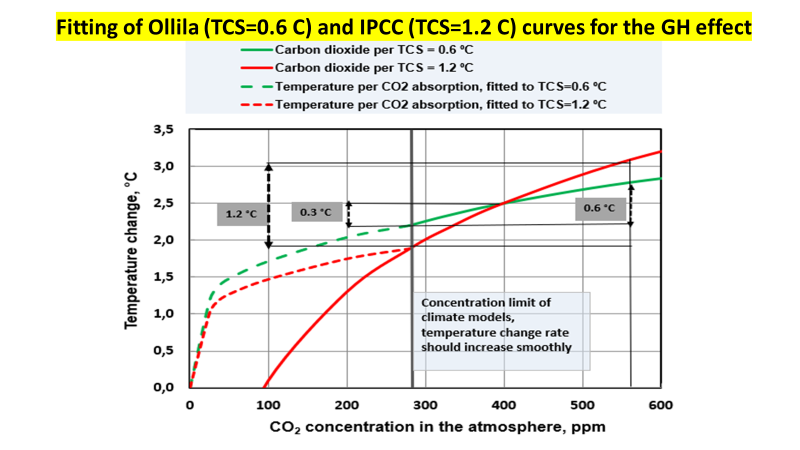
Figure 1. Warming effects of CO2 according to the new greenhouse effect of CO2 being 2.5 ⁰C in 2014 (400.9 ppm). CO2 warming effects from 280 ppm onward are per a green curve, TCS = 0.6 ⁰C, and per IPCC (2013), a red curve, TCS = 1.2 ⁰C.
The absorption effects caused by three GH gases are depicted in Fig. 2. The absorption curve of carbon dioxide has been utilized in making the dashed green curves in Fig. 1. The absorption is the basic process causing the warming effects of GH gases. By the same token, it is easy to realize that the warming effects of methane and nitrogen oxide stay below the carbon dioxide curve. The Global Warming Potential (GWP) values are misleading and they cannot be used for calculating direct warming impacts.
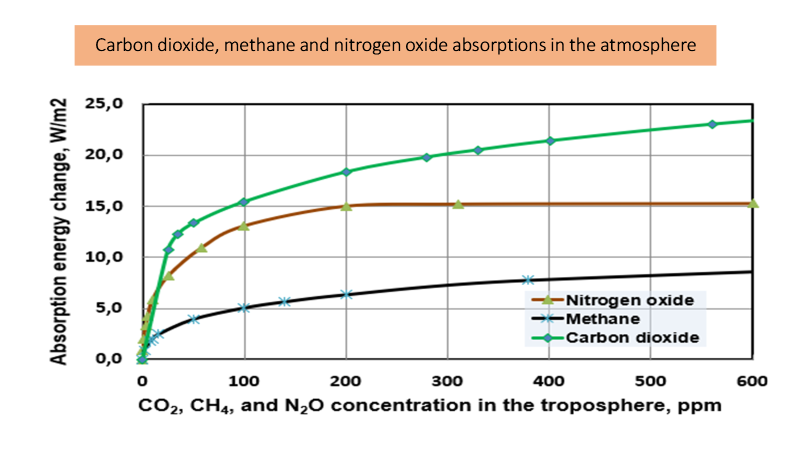
Figure 2. The absorption curves of carbon dioxide, methane and nitrogen oxide in the troposphere.
The curve of the model (TCS = 0.6 ⁰C) according to Eq. (1) of this study shows a smooth feature of a warming rate without a transition point at the 280 ppm. The curve of the IPCC model (TCS = 1.2 °C) has a transition point at 280 ppm because the angle coefficient starts to increase after 280 ppm when it should steadily diminish. This curve fitting shows that the IPCC model cannot be fitted into this new GH effect magnitude.
The absorption due to a GH gas follows also another general rule of absorption that the starting phase approximately follows the Beer-Lambert law, which states that absorbance depends linearly on the concentration and path length. When the concentration increases, this relationship is no longer valid. There is no rule when this linear relationship ends, and it is different in each case. In this case for CO2, it ends at about 20 ppm, and thereafter the relationship is very nonlinear to 100 ppm for CO2. Thereafter the relationship is slightly nonlinear after 150…280 ppm, which can be approximated by a logarithmic relationship very well.
A general feature of absorption is that the LW absorption rate change, i.e. the angle coefficient of the absorption curve, diminishes with increasing GH gas concentration. There is a simple physical explanation for this feature because the available energy for LW absorption is getting smaller and smaller with increasing absorptions by GH gases, Fig. 3. The GH gases and clouds absorb about 88 % of the available radiation emitted by the Earth’s surface. Two days of three are cloudy and then absorption is 100 % which means total GH effect.
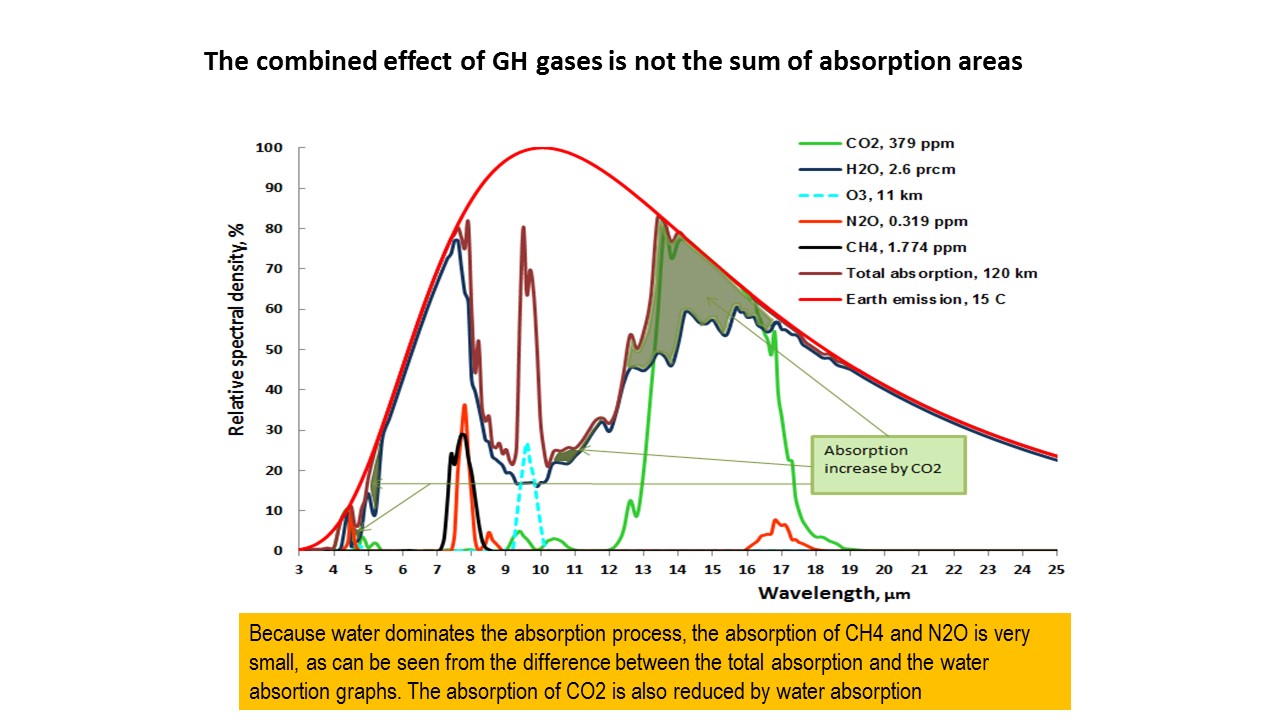
Figure 3. The absorption areas of GH gases in the average global atmosphere. Water dominates.
People think that the absorption/warming process produces a linear relationship between the CO2 concentration and temperature. Therefore, they may think that there is no problem if 400 ppm causes a warming effect of 2.5°C and the concentration change from 280 ppm to 400 ppm produces 0.95°C. But it is impossible because the relationship is highly nonlinear as shown in Fig. 1. The CO2 concentration of 280 ppm in 1750 has caused the temperature increase of 2.2°C, today the total warming value is about 2.5°C and the concentration 560 ppm causes 2.8°C warming meaning the climate sensitivity value of 0.6°C according to the Ollila model.
The final outcome is that the climate model TCS=1.8°C or TCS=1.2°C cannot be fitted into the correct GH effect but the climate model TCS=0.6°C (Ollila model) fits very well. I think that this is the basic reason, why the IPCC defines the GH effect in the wrong way and why climate researchers use this wrong calculation basis. The wrong GH effect magnitude raises the ceiling high enough for covering up that the climate models are far too sensitive for CO2.