
Do the math. Reject the WEF global resetters!
Bud Bromley | August 3, 2022
Do the math.
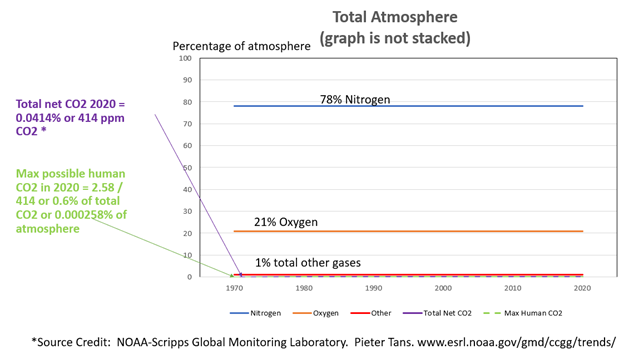
- Net CO2 in air for 2020 was ~414 ppm, that’s 0.000414 *
- Human CO2 cannot exceed 2.58 ppm, that’s 0.00000258, i.e., the net CO2 increase due to all sources & sinks for year 2020 = 2.58 ppm. Net human CO2 cannot exceed 0.000258% of atmosphere. *
- 2.58/414 = 0.0062 = 0.62% Net human CO2 cannot exceed 0.62% of net total CO2 for 2020.
- In 1970, average net CO2 was 325.68 ppm *
- In 1969, average net CO2 was 324.62 ppm *
- 325.68 minus 324.62 = 1.06 ppm *
- For 2020, average net CO2 was 414.24 ppm *
- For 2019 average net CO2 was 411.66 *
- 414.24 minus 411.66 = 2.58 ppm *
- 50 year maximum possible net human CO2 increase = 2.58 minus 1.06 = 1.52 ppm
- Increase in 50 years total net CO2 = 414.24 minus 325.68 = 88.56 ppm = 1.77 ppm/yr
- Slope for total net CO2 = y = mx+b
- 414.24 = m50 + 325.68
- (414.24-325.68)/50 = m = 1.77 ppm/year average
- Slope for 50 year maximum possible human CO2 increase y = mx + b
- (2.58 – 1.06)/50 = m = 0.0304 ppm/yr average
- 1.77 / 0.0304 = 58
- Total net CO2 growing 58 times faster than maximum possible human CO2.
- Therefore, human CO2 is not causing growth in global CO2.
It is maximum possible net human CO2 because the annual increase from 1969 to 1970 (i.e., 1.06 ppm), and the annual increase from 2019 to 2020 (i.e., 2.58 ppm), includes the increase in CO2 due to all CO2 sinks and all CO2 sources, human and natural, for those two years. There is no CO2 “atmospheric fraction” hidden or accumulating somewhere.
As stated previously on this blog, if net human CO2 emissions were causing the slope in net global average atmospheric CO2 concentration, then the two slopes must be parallel or intersect, that is, there must be a positive correlation. However, the two slopes are diverging over time, the correlation is negative, therefore net human emissions cannot be the cause of the increasing slope of net global average atmospheric concentration.
Using these same data 1970-2020, annual averages, there is an apparent increase of about 88.56 ppm (414.24 – 325.68) over the 50 years, which is only about 1.77 ppm per year. This is already a small amount and probably would be lost in the noise of the two giant fluxes, i.e., c absorption flux and CO2 emission flux. But even that 1.77 ppm/yr needs further investigation. For example, there is the larger seasonality (i.e., the sharks teeth seasonal cycle) which has larger variation at some of the sampling locations than the 1.77 ppm/yr, but not at other locations. And no doubt there are other cycles to be found in the data, el Nino’s for example, and human population differences driving CO2 emission differences between northern and southern hemispheres.
Is this 1.77 ppm/yr a net accumulation of CO2? Or is this an adjustment of the partition ratio resulting from the phase-state reaction and partition of CO2 gas between air vs the environment, mostly ocean surface? Or, is the phase-state partition ratio perturbed by a trend in sea surface temperature? Or, perhaps perturbed by temperature, salinity, alkalinity or partial pressure changes at the measurement location?
NOAA-Scripps averages averages of averages, as they acknowledge in the footnote of the table in one of their papers copied below. It is well known that this is bad practice and results in errors. But it depends on how exactly it is done. To figure this out is time consuming, as you can imagine.
For example: the average of {2,2,2,2,2,2,2,2,2,2,2,2,2} is 2, (N=13) and the average of {4} is 4. (N=1). The average of the averages is 3. But the average of all numbers is 30/14 ≃ 2.14. It is possible to produce a trend in the data by averaging averages post data collection.
It is curious that they report – for 60 years – uncertainty of each annual mean of exactly 0.12. They define uncertainty, “The estimated uncertainty in the annual mean is the standard deviation of the differences of annual mean values determined independently by NOAA/ESRL and the Scripps Institution of Oceanography.”
Is this apparent trend in CO2 concentration of 1.77 ppm per year real? And, what are the effects of suppression of the variance in the data due to the averaging of averages?

References:
Thoning, K., Tans, P., Komhr, W. 1989. Atmospheric carbon dioxide at Mauna Loa Observatory: 2. Analysis of the NOAA GMCC data, 1974-1985. Journal of Geophysical Research.
Abstract: The first 12 years (1974–1985) of continuous atmospheric CO/sub 2/ measurements from the NOAA GMCC programs at the Mauna Loa Observatory in Hawaii are analyzed. Hourly and daily variations in the concentration of CO/sub 2/ due to local sources and sinks are described, with subsequent selection of data representing background concentrations. A digital filtering technique using the fast Fourier transform and low-pass filters was used to smooth the selected data and to separate the seasonal cycle.
Tans, P. CO2 annual means 1959 -2020. NOAA and Scripps. Global Monitoring Laboratory. File Creation: Fri Mar 5 08:40:06 2021. http://www.esrl.noaa.gov/gmd/ccgg/trends/