
Carbon Dioxide and the Oceans
FOCUS Magazine: Australian Academy of technological sciences and engineering
August, 2008
Should we try harder to understand the causes of natural climate change instead of assuming present climate change is man-made?
 By Lance Endersbee
endersbee@optusnet.com.au
In the past, sea temperatures were obtained from measurements by passing ships in the sea lanes of the world. It is only in the past three decades that more accurate data on sea surface temperatures has become available. The analysis of this recent data by the author shows that:
- the oceans regulate the composition of the
atmosphere; - the influence on climate of human-generated carbon dioxide (CO2) in the atmosphere is negligible;
- and global climate change has natural causes.
The oceans and the atmosphere are quite shallow in relation to the vast surface area of the oceans. The interaction of the atmosphere and the oceans is essentially a phenomenon of the ocean surface. It would be expected that there would be almost a direct correlation between levels of CO2 in the air and the global mean sea surface temperatures, and that is the case.
It is possible to plot an experience curve of the relationship between ocean temperatures and atmospheric CO2 levels. In order to do so it is necessary to recognise that the oceans have a vast storage capacity for heat and dissolved gases, and that changes are slow.
On the other hand, the atmosphere has a much more rapid response time. If we use a 12-month moving average of atmospheric CO2 and a 21-year moving average of the more accurate recent data on global average sea surface temperatures, a remarkably clear experience curve is obtained.
The 12-month moving average of CO2 levels filters out the variations of the annual cycle and, in related analyses, provides a view of the influence of other natural events. The 21-year moving average of sea surface temperature covers the complete solar cycle, including the change in magnetic polarity of the sun, the El Niño and La Niña influences on global climate, and recognises the vast storage capacity of the oceans for CO2 and the slow response time of the oceans.
The chart shows that the CO2 levels in the atmosphere and global average sea surface temperatures are locked together. The correlation is so firm it is reasonable to include it as a condition in the computer simulations used to study climate change.
The recent increase in CO2 in the atmosphere is an evident fact. The critical questions to be considered are whether the man-made emissions of CO2 are the actual cause of the increase in levels of CO2 in the atmosphere, and the actual cause of global warming, or whether the global warming arises from natural causes.
If the global warming is due to natural causes, it follows from the correlation that the increase in CO2 in the atmosphere is also due to natural causes.
There is seriously harmful air pollution in most large cities of the world. It is caused in large part by use of carbon fuels, but it does not necessarily follow that CO2 emissions cause global climate change.
Atmospheric pollution is man-made and mostly close to the sources of emission. The large cities are also hotter, but this is mainly caused by the vast areas of black pavements and the dark buildings that absorb the heat of the sun, and continue to release that heat at night.
Air pollution and global climate change are scientifically separate issues. Air pollution is man-made, local and regional. Climate change is natural and global.
We know from our affection for champagne that CO2 is soluble in water, that the bubbles appear when the pressure is reduced to atmospheric pressure, and that the bubbles in our glass disappear as the bubbly warms to room temperature. It is the same with the oceans and the atmosphere. The oceans can store CO2 under pressure. When the surface of the ocean is cold it absorbs CO2 and when it is warmer it releases CO2 to the atmosphere. The long-term global average sea surface temperature is about 15˚C. At 15˚C and atmospheric pressure water can absorb its own volume of CO2. At five degrees cooler (10˚C) water absorbs 19 per cent more than its own volume, and at five degrees warmer (20˚C) water absorbs 12 per cent less than its own volume. Thus a warmer ocean releases more CO2 into the atmosphere.
The temperature of the oceans decreases markedly with depth. The deeper and colder oceans have a huge capacity to store and release CO2. If the pressure in the water is increased to two atmospheres, equivalent to a depth of water of only 10 metres, the volume of gas absorbed is doubled. The moisture in the atmosphere also absorbs and releases soluble gases with changes in pressure and temperature. Clouds can be regarded as gaseous ionised solutions.
During the period of record on the chart, the sea temperatures have been rising. The sun is now quiet and solar experts believe that the sun may be entering an extended quiet period.
Global average sea surface temperatures are now starting to fall. It is reasonable to contemplate that sea temperatures may gradually decline towards the average of the previous century. That would be a drop of about 0.35˚C. That would mean that atmospheric CO2 levels would also similarly decline towards the average of the past century.
The past winter in the northern hemisphere has been the coldest for several decades. The next winter in the northern hemisphere seems likely to be even colder, reducing the northern growing season and having an impact on world grain supplies.
In essence:
- emissions of CO2 are not a cause of global climate change;
- there is no need for carbon trading, or geosequestration;
- measures to ensure energy conservation, pollution control and sustainability are all rational, and do not need to be justified by fear of climate change;
- CO2 in the atmosphere may decline in the next decade or so to the levels of the past century; and
- it is reasonable to be prepared for natural global cooling, similar to the periods of cold climate in our recent recorded history, when there was the severe and hazardous cold on occasion between 400 and 600AD during the Dark Ages, and 1300 to 1800 in the Little Ice Age. These were natural events and there is some evidence of naturally recurring behaviour.
It is my view that the present fear of man-made climate change is quite mistaken. We should try harder to understand the real causes of natural climate change.
Emeritus Professor Lance Endersbee AO FTSE is a civil engineer of long experience in water resources development. His early professional career included service with the Snowy Mountains Hydro-Electric Authority, the Hydro-Electric Commission of Tasmania and the United Nations in SouthEast Asia as an expert on dam design and hydro power development. In 1976 he was appointed Dean of the Faculty of Engineering at Monash University. In 1988-89 he was Pro-Vice Chancellor of the University. He is a former President of the Institution of Engineers, Australia. His fields of specialisation include the management of planning and design of major economic development projects, water resources, energy engineering and transport engineering.
Experience curve showing dependence of atmospheric carbon dioxide on global average sea surface temperature using data from January 1985 to May 2008
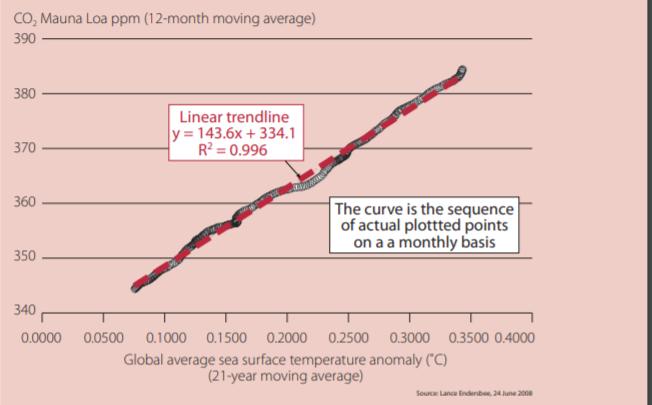
(Above) an experience curve relating actual atmospheric CO2 levels with actual global average sea surface temperature. It is not a time scale, just the simple relation between two physical parameters independent of time. The line shown is the sequence of actual plotted points for each end month of the two moving averages. The range of temperature is quite small and it is reasonable to use a linear trend line. The correlation is remarkable and would be considered a perfect correlation in laboratory tests. It is emphasised that the chart presents recent data and is just a plot of actual experience.