
Global temperature dropped to the pause level of the early 2000s
Dr. Antero Ollila | April 3, 2021
The satellite temperature measurement of the March has been published, Figure 1.
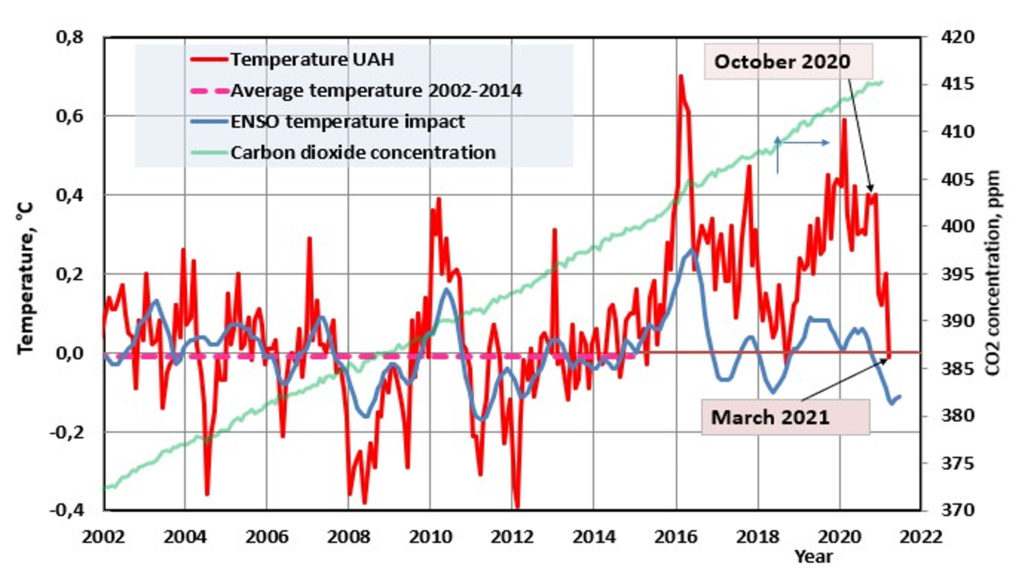
Figure 2. Monthly values of satellite temperature UAH in 2002–2021. The impact of ENSO events has been calculated using the formula 0.1*ONI (Oceanic Nino Index) applying a delay of five months.
The temperature of March has dropped to pause temperature average of 2002-2014, generally known as temperature pause or hiatus.
Since October 2010, the temperature has dropped from 0.4 °C in October to 0.15 °C in December, to 0.12 °C in January and to -0.01 °C in March. Temperature changes from 2014 to 2014 can be estimated against the background that carbon dioxide (CO2) concentrations have increased from 398.87 ppm to 414.24 ppm respectively. According to IPCC science, this change causes a temperature change of 0.1 °C, or 0.02 °C per month. After 2014, the culprit for drastic temperature changes cannot be CO2 or man, even not according to IPCC science, although the media writes this.
The strong temperature increase of about 0.6 °C caused by the 2015-16 super El Nino is well known, but there is an understandable desire to be quiet about it in this context, as the general public is unaware of this. The temperature effect of ENSO events is shown in the picture as a blue curve. Until 2014, ENSO events explain quite well the changes in temperature, but after 2014 the temperature has been high in 2019-2020, even though El Ninos have been small in size.
For the high temperatures in 2019 and 2020, I have not seen any unusual reasons in research results or blog posts, with exceptions to references 1 and 2. Figure 2 shows the main cause of this recent warming. There are three full-scale experiments on the climate. Mother Nature has quietly arranged an easy-to-measure experiment, which has silenced both the climate elite and dissidents. It’s a change in solar radiation, but since it’s not due to a change in solar activity, I call it shortwave radiation, which has grown sharply specially since 2014. The latest available value is from December 2020, which shows that we are still above 2019 levels, but below 2020.
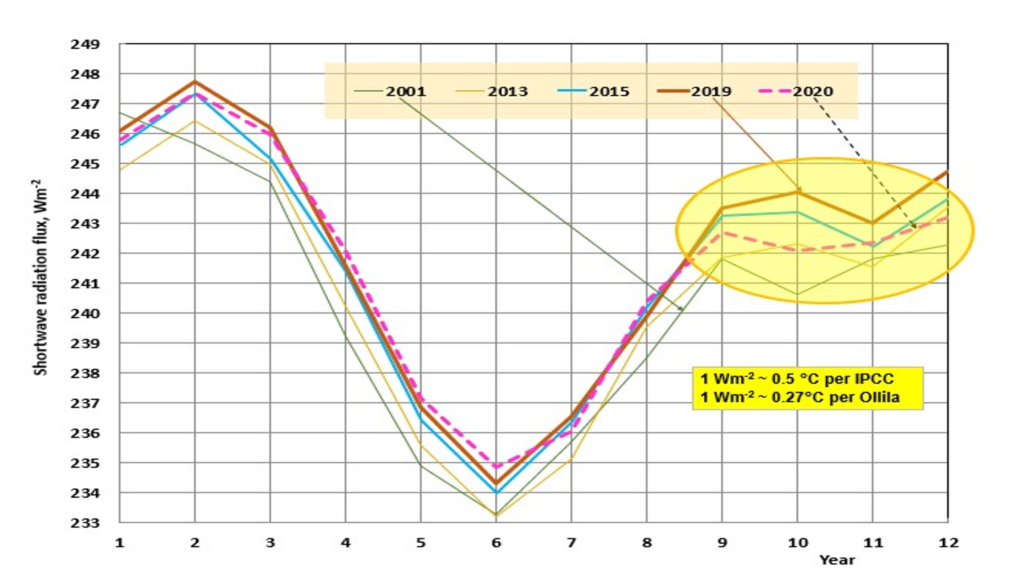
Figure 2. Annual trends in shortwave radiation from a few years 2001 to 2020.
The radiation level in 2021 is clearly lower than in the later years. The trend in 2020 initially followed the 2019 curve closely, but then there was a change after September. Global temperatures fell sharply in December 2020 and have remained at low levels and have now fallen to -0.01 °C in March.
One can conclude by naked eye in Figure 1 that the carbon dioxide content is rising steadily, but the temperature is travelling on its own paths and now it has dropped down sharply. One of the reasons given by the climate establishment for this ‘apparent’ lack of causation is that it is a natural variation. I can fully agree with that and the reason is clear: it is the sun and cloudiness variations.
References
-
Loeb NG, Thorsen TJ, Norris JR, Wang H, Su W. Changes in earth’s energy budget during and after the “pause” in global warming: an observational perspective. Climate. 2018;6:62. doi:103390/cli6030062.
-
Ollila, A. The pause end and major temperature impacts during super El Niños are due to shortwave radiation anomalies. Phys. Sc. Int. J. 24(2), 1-20 (2020).