
The New Pause lengthens by another month to 5 years 7 months
By Lord Christopher Monckton of Brenchley | March 5, 2021
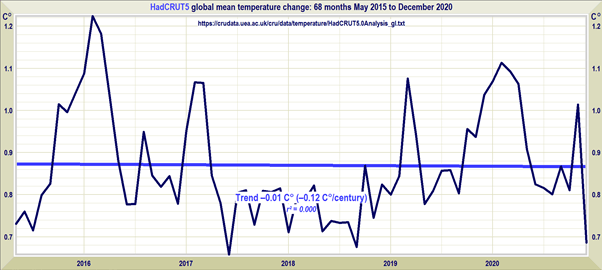
The New Pause continues. To the end of December 2020, it was 5 years 4 months. To the end of January 2021, it was 5 years 6 months. To the end of February 2021, it is 5 years 7 months:

Up to December 2020, for which I have data for two satellite and two terrestrial datasets, UAH and RSS showed the shortest Pause, while HadCRUT4 shows the longest, at 6 years 6 months:


The difference between the lengths of the New Pause in versions 4 (6 years 6 months) and 5 (5 years 8 months) of the HadCRUT dataset to December 2020 is a whopping 10 months, which the newer version wipes off the New Pause. As Willis Eschenbach has recently pointed out, the tamperings between versions 4 and 5 chiefly affect recent years: for once, the earlier years of the HadCRUT dataset have been left comparatively unadjusted. Could it possibly be that the emergence of this new Pause is giving the usual suspects – er – pause for thought?
The two satellite datasets, UAH (trustworthy) and RSS (run by a “scientist” who resorts to hate speech, calling those of us whose research suggests small and harmless global warming “climate deniers”), continue to show very different warming trends. From 1979-2020, RSS, at 2.16 C°/century equivalent, shows 58% more warming than UAH. Settled? Schmettled.
Charts are below. For interest, I have also added the chart of the Central England Temperature Record from 1979-2020, which, being a regional record, shows how trivial the trend is when set against the annual winter-to-summer temperature cycle. It shows warming equivalent to almost 3 C°/century, but that is a regional and not a global mean, and the discrepancy between the regional and the global average is not entirely unexpected given poleward advection. The CETR showed warming at 4.33 C°/century equivalent over the 40 years 1694-1733, and has not shown warming at or above that rate in any 40-year period since then, so there is nothing unprecedented about the recent warming rate.
I’m taking bets on which of the various datasets will be the next to produce sophisticated excuses for the next tamper-tantrum, resulting in yet another hike in the apparent warming rate.


Finally, now that we have HadCRUT5, I have taken uncertainty intervals for each of the five mainstream climatological parameters (green) and added them to the table that shows how equilibrium doubled-CO2 sensitivity (ECS) is derived from them:

The current generation of models predicts ECS on 3.7 [2.0, 5.7] K. In reality, based on real-world observation rather than artfully profitable speculation, ECS will fall on 1.0 [0.8,1.4] K. And that is far too little to require any mitigation whatsoever. Cancel COP26! Shutter IPCC! Climatology’s predictions are about four times reality.
But can it really be as simple as this to derive ECS? Don’t we need complex models costing billions? Don’t we need multi-thousand-page IPCC reports every few years? Well, no, we don’t. The equations for the energy-imbalance factor Γ, for the implicit anthropogenic equilibrium sensitivity ΔE1 in the industrial era from 1850-2020 and then for ECS ΔE2, though very simple, are a reasonable and robust method of deriving ECS reliably from Their own recent, mainstream data, updated in a series of papers intended to be in time for IPCC’s Sixth Assessment Report.
The last line of the table is particularly interesting. It derives the unit feedback response –the response per degree of direct warming – from 1850-2020 (U1). Then it compares U1 with the feedback response U2 from 2020 to warming driven by a forcing equivalent to doubled CO2 compared with 2020.
U1, which at midrange is actually negative, at –0.06, indicating very slightly net-negative feedback in the industrial era, and not the grossly net-positive feedback imagined in the models, is 1 less than the industrial-era system-gain factor A1, the ratio of period equilibrium sensitivity ΔE1 to period reference sensitivity ΔR1, where ΔR1 is 0.3 times the period anthropogenic forcing ΔQ1.
There is little more than 2 degrees’ difference between temperatures in 1850 and at doubled CO2 compared with 2020. Therefore, U2, the post-2020 unit feedback response implicit in the model-projected ECS, ought to be about the same as U1.
At most, the ratio X = U2 / |U1| of the two unit feedback responses ought not to exceed about 1.1. But the interval of unit-feedback-response ratios X implicit in the models’ global warming predictions is an astonishing and manifestly untenable 39 [14, 69].
Just for fun, we calculated what X would be if the sillier and more extreme papers predicting 10 degrees’ ECS were true. Then X would exceed 130: that is, X would exceed any reasonable value by two orders of magnitude.
Couldn’t climatologists have done these simple sums for themselves and realized how grievously overblown their profitable but damaging predictions were? Why did they ever imagine that ECS would be anything like 3 or 4 degrees at midrange, when in reality it will be a harmless and beneficial 1 degree (and only that much on the generous assumption that the official estimates of greenhouse-gas forcings are not overstated)?
The reason is that they imagined that the 32-degree natural greenhouse effect comprised only two components: 8 degrees’ reference sensitivity to preindustrial noncondensing greenhouse gases and 24 degrees’ feedback response thereto (see e.g. Lacis et al., 2010). On that basis, they thought that 1 degree of doubled-CO2 reference sensitivity would become about 4 degrees’ ECS – and the current models’ midrange prediction is indeed close to 4 degrees.
They had forgotten that much of the 24 degrees’ total preindustrial feedback response was a response not to the preindustrial noncondensing greenhouse gases but to the 25-times-greater emission temperature that would prevail near the surface even if there were no greenhouse gases in the air at the outset. The larger the feedback response to the warmth from the Sun, the smaller the feedback response to the greenhouse gases.
Bless their little cotton socks, they had forgotten the Sun was shining. That strikingly elementary error is why the world is in a childish panic about global warming.