Our mission is to educate the largest number of citizens possible on the fraudulent science, politics, and business of the deceptive carbon dioxide based anthropogenic global warming hypothesis through rigorous scientific experimentation and analysis, and the false viability of “renewable” energy sources; thereby negating the green energy agenda of America’s elected leaders, leading to the removal of carbon dioxide from the U.S. EPA’s 2015 Endangerment Finding and the elimination of all carbon regulation, taxes, and trading worldwide.
This is a full transcript of a talk given by Dr John Christy to the GWPF on Wednesday 8th May.
When I grew up in the world of science, science was understood as a method of finding information. You would make a claim or a hypothesis, and then test that claim against independent data. If it failed, you rejected your claim and you went back and started over again. What I’ve found today is that if someone makes a claim about the climate, and someone like me falsifies that claim, rather than rejecting it, that person tends to just yell louder that their claim is right. They don’t look at what the contrary information might say. (more…)
test_mcb8msPosted on 7:37 am0 Comments
Man-Made “Climate Change” Hoax
By Len Duggan | June 2, 2016
CO2 Climate Change Hoax
This article will show how some highly emotive issues have been wrongly linked to atmospheric CO2 concentrations. It will then address the media claims that the “science is settled” and show that most climate scientists actually believe man’s emissions of gases are not responsible for global warming. It will then show that mistakes were made in the design of the climate models that were used by the IPCC to identify CO2 as the driver for global warming and that these sub-standard climate models were then used to make erroneous predictions of global temperature change in the future. It will show how corrupted “cherry-picked” data was used and that this data was further corrected by NOAA, rendering doubt on its usefulness and reliability. It will outline some of the political reasons behind the CO2 scare that is propagated by the IPCC and show that many respected climate scientists disagree with the IPCC prognosis. It will also show no real global warming has occurred in the last 150 years and how data has been corrupted and is therefore misleading. It will show that high CO2 levels are not harmful but are instead beneficial to life on Earth because high CO2 levels enable plants to grow bigger, stronger and healthier. It will show that the ability of plants to fix vast amounts of CO2 from the atmosphere is completely overlooked in all climate models. It will list testimonials from many respected climate specialists who believe man is not responsible for the non-existent global warming that we now call climate change. It will then show that the variation in distance between the Sun and the Earth as a result of the orbital cycles of the Earth known as the Milanković Cycles are the real driver for any climate change. This fact and understanding of the Milanković Cycles as the driver for global temperature change will be qualified with reference to many scientific studies.
First, we must make sure we understand what we are talking about. There are many bad things happening in the modern World we live in, but we can be sure none of those things have any connection to the concentration of CO2 in the atmosphere. CO2 never polluted the ocean with plastic, it was never responsible for government and corporation agendas for deforestation, it was not responsible for the Fukushima accident, it never poisoned the ground through fracking, it isn’t responsible for the microparticles of plastic in our water bottles, it didn’t poison the groundwater in Flint, it is not responsible for any of the wars in the world. It didn’t cause mass die-offs of fish and birds, it hasn’t killed the pollinating insects, CO2 didn’t pollute living things with aluminium, it didn’t cause pollution through oil spills, it is not responsible for the increase in autism and it didn’t bring down 3 towers on 911.
There have been claims made on numerous occasions in the media that 97% of scientists agree “that man is responsible for global warming” and that “the science is settled”. This claim originated from the 1993 “World Scientists’ Warning to Humanity”(40) and is quoted by the media and others as being a warning about CO2, but the study was warning about ozone depletion, freshwater resources, reconstructed marine catch, dead zones, deforestation, vertebrate species extinctions and human population levels too. CO2was mentioned as a warning by the scientists in relation to the information gleaned from IPCC climate models without the knowledge that they were erroneous. Again, the media repeat the 97% in 2008, however, on examination this study hand-picked 77 replies from a planned 10,257 scientists, of the 77 hand-picked replies 75 agreed that man-made CO2 was to blame. 75 out of 77 is 97% and these 75 scientists have been published in the media as representing a global consensus and allowed to decide the future of mankind. Again the media repeated the same “97%” headlines but this time relating to the 2013 study by Cook. This study used a system were authors of the papers included “rated the abstracts” and “self-rated” their papers allowing for a conclusion that “Among self-rated papers expressing a position on AGW, 97.2% endorsed the consensus”. Not only is this not science but after re-examination of the data it was found that only 64 of the 11,944 science studies came to the conclusion that man was responsible for global warming. These false headlines are repeated many times over a long period of time by the media to make them seem more believable and this travesty of false science promoted by some individuals is documented in a book called “A Disgrace to the profession” by Mark Steyn. The reporting and manipulation of knowledge by the media is further highlighted by the fact that a far larger consensus of 31,479 signers, of which 9,029 hold PhDs, who say they wholeheartedly disagree that man is responsible for global warming through CO2 emissions and back the study by Robinson et al.(49).
The media has also claimed that CO2 is responsible for acidification of the oceans, but this is misleading too. It is impossible for the sea to change pH because it is buffered by calcium carbonate in the sediment. This is clarified by Raven in the 2005 study into acidification of the oceans. The study says “The carbonate buffer acts to stabilise the average pH of seawater at approximately pH = 8 because of the following two processes: (i) uptake of CO2 from the atmosphere and (ii) interaction of seawater with oceanic sediments composed of CaCO3. Because CaCO3 is abundant in sediments, the pH of the deep oceans cannot change by large amounts over timescales of 10 000 years”(41). It accepts that changes can occur near to the surface, but these small changes are obviously mixed by upwelling from the depths. Therefore, the pH of the ocean is still 8.1. We are also told that the sea level is rising but this is not true either. The sea level is calculated using measurements obtained from ground stations that are on land that is sinking and satellites that are in orbits that are degrading and therefore erroneously showing the sea is rising when in reality this is not the case. The latest European satellite called “Envisat” is able to measure the sea level to millimetre accuracy and is able to detect the rise and fall of 4 millimetres between summer and winter as the oceans warm and cool. Envisat shows that there is no rise in sea level and this is explained by NASA scientists in a video titled “25 NASA Scientists Question the Sanity of the Global Warmists”. Their website can be accessed from https://www.therightclimatestuff.com/home.html and a synopsis of their findings can be found here.
We are also told in the media that CO2 has increased by 50% but this is misleading people too, because in reality CO2 has risen from 0.032% of the atmosphere in 1960s to a grand total of 0.041%. Not only is it obvious that this small rise in CO2 concentration of 0.009% over 60 years will not make any difference at all, but considering the Mauna Loa observatory is next to an active volcano the data set arising from that place could be unreliable. NOAA say that CO2 levels are rising by an average of 2.5 ppm each year, that is only 0.0025% per year and this may be as a result of changes in CO2 use by trees through deforestation and not because of additional CO2 from industrialisation. I can only imagine that the “50% rise in CO2” quote that is being used to describe the CO2 increase is designed by the media to evoke an emotional response in its readers. Radiative forcing is measured in watt per square metre (W/m2) and a 1998 study estimated the radiative forcing of CO2 as 1.8 W/m2(44) but a study of contrail induced cirrus cloud, colloquially known as chemtrails, has proven the clouds that grow from the exhaust of planes has a warming effect of 10 W/m2 during daylight hours and 30 W/m2 during night time(45). Therefore, the clouds left by planes have a far greater effect on the warming of the planet than CO2 ever could.
The NOAA study (June 2014) suggests that global warming is still going on but only because they massaged their data too(3). NOAA are claiming that their data needed to be corrected in light of the fact that the “Ships collecting temperature data did so first by gathering water either in wooden buckets, in canvas buckets, by thermometers positioned near engine intake valves, and later buoys – resulting in temperature measurements that varied slightly by collection method and requiring correction”(6). This is obviously a flawed approach to understanding and working with the figures collected because the problem NOAA have highlighted in the methodology would have actually resulted in the recorded temperatures being higher than reality and not lower as they are suggesting. Obviously, NOAA has corrected the figures in the wrong direction, multiplying the mistake instead of rectifying it. Temperature figures subjected to arbitrary corrections by the statisticians can never be trusted as showing reality in any way(6). When Dr Evans used unadulterated figures from satellites he found a very different outcome that disproved a causal effect of CO2 as the driver for Climate Change(2).
Climate scientists made a simple mistake within the climate model architecture and this mistake changed the results obtained from the models completely. The heat trapped by the increasing levels of carbon dioxide just reroutes to space via water vapour. This whole category of feedback was omitted, which greatly exaggerated the calculated sensitivity to carbon dioxide. This one miscalculated fact was enough to skew the results so that they could be used to support the misunderstanding that claims CO2 drives climate change(1). The big scare of CO2 being responsible for global warming was due to a simple modelling error. Dr David Evans is a very well qualified climate scientist with many years’ experience who checked the architecture of the current climate models and discovered that while the underlying physics was correct, the climate scientists applied it incorrectly and that “two serious architectural errors were discovered in the basic climate model”(1). These 2 errors were then fixed by Dr. Evans and the original model was run again and future warming due to carbon dioxide was found to be only 10% or 20% of the previous official estimates. The conventional climate models had been set up to work in a way that amplified the surface warming effect of CO2(2). The actual recorded temperatures agreed with the new results from the model fixed by Dr. Evans therefore, allowing us to be sure that the new model architecture is correct. This new model proves there is no global warming due to CO2(2).
The IPCC are using these amplified results from the faulty climate models and the NOAA faulty study to scare people into accepting their political control. They cite the melting of the ice caps with Greenpeace as further proof of climate change, but the truth is that they have no idea of the ice thickness before the first satellite took measurements in 1973. They had to rely on information from Russian explorers after they returned from summer trips. No one entered the ice during the winter months. No data exists for the winter months in any way before 1973(6). A review in 2016 identifies “nothing in the data” that “supports the supposition that atmospheric CO2 is a driver of weather or climate, or that human emissions control atmospheric CO2”. The study goes on to explain how the “medieval warm period” acknowledged in the IPCC data and peaked at around 1200 AD with no greenhouse gas contribution. The study also noted that the changes in global temperatures cycled through a time period of approximately 100,000 years and correlated with the “eccentricity of the Earth’s elliptical orbit about the sun” and confirms a recent increase in solar activity by cosmic ray intensification. The study also identifies a lack of reliable data and how it is difficult to access when it is published. It explains how authors’ interpretations of this data have appeared “primitive” and “cherry-picked” to conform to the IPCC’s “party line” about the dangers of “greenhouse gases”(19). It was also found by studying chironomid remains in the sediments of Lake JR01 on the Boothia Peninsula in the Central Canadian Arctic that although “Indices of both aquatic and terrestrial biological production increased in the last 150 years the reconstructions do not indicate warming”(20).
The wrong understanding of the consequences concerning raised CO2 levels has been taught to us all in the media promoted information. We have been led to believe that high CO2 levels are somehow dangerous to us and the planet. The reality is that the planet is at its most healthy when CO2 levels are at least 20 times higher (7,000 ppm) than the current levels today (400 ppm)(8). Plants use CO2 for their health, and growth responds dramatically when levels are increased. Higher CO2 levels result in higher yielding and better-quality crops in our fields as well as encouraging the better overall health of our planet. CBS news reported that humans contributed 38.2 Gigatons of CO2last year(46). However, plants fix CO2 from the air and the more CO2 that is present in the air, the more plants will fix using photosynthesis. At levels of 350 ppm CO2 plants fix 51 Gigatons and if the levels rise to 650 ppm, then plants will fix 64.3 Gigatons per year. This increase of 13.3 Gigatons of CO2 fixed by the trees is completely overlooked by climate scientists. We should think of our CO2emissions as more food for animals to thrive on(9). If CO2 levels dropped too low (150 ppm) we would be approaching a total world extinction event. CO2 is not our enemy and this is why CO2 generating equipment is used in commercial greenhouses(10).
The identification of CO2 as the driver for climate change/global warming has been the product of powerful corporations with aims of controlling the world through domination of finance and food production. The control of world industry and food production can best be accomplished by the control and restriction of CO2(5). It is the will of big business, bankers and corporations to massage the global warming figures to initiate the control of Carbon Dioxide emissions for the purpose of raising revenue by licensing industrial CO2 emissions. Edmund de Rothschild founded the “World Conservation Bank” in 1987 for the purpose of controlling the CO2 emissions(5). This was formalised at the 2009 United Nations Climate Change Conference in Copenhagen with the imposition of an international tax of 2% on all financial transactions. This tax would be controlled by the UN and returned to the Rothschild World Bank. The IMF and Rothschild are interconnected and support for the Rothschild controlled financial agenda comes from all angles(7).
There are scientists and corporations entering into an unholy alliance enabling big business to have the ability to influence opinion-makers on the extreme right of the U.S. political spectrum. Recently we have seen the effect of this influence in health and environmental sciences. The purpose of this alliance has been to deny established scientific knowledge and is known as “tobacco science” because of its advice given in bad faith. “Merchants of Doubt” is a serious book written to expose a group of scientists who fought the scientific evidence to purposefully spread confusion on many of the most important issues of our time. Unfortunately, we cannot trust scientists to explain scientific findings with honesty. We must look directly at the scientific facts and check these against the politically influenced rhetoric we are given(4). Data anomalies have been documented showing the altering of data to suit the IPCC narrative(38).
In Senator James M. Inhofe’s speech at the 2003 Senate commission on “The Science of Climate Change” he quoted Dr. Frederick Seitz, a past president of the National Academy of Sciences, and a professor emeritus at Rockefeller University as claiming “There is no convincing scientific evidence that human release of carbon dioxide, methane, or other greenhouse gasses is causing or will, in the foreseeable future, cause catastrophic heating of the Earth’s atmosphere and disruption of the Earth’s climate. Moreover, there is substantial scientific evidence that increases in atmospheric carbon dioxide produce many beneficial effects upon the natural plant and animal environments of the Earth(47)”. Senator Inhofe also highlighted that in 1974 the National Science Board, the governing body of the National Science Foundation, stated: “During the last 20 to 30 years, world temperature has fallen, irregularly at first but more sharply over the last decade.” Two years earlier, the board had observed: “Judging from the record of the past interglacial ages, the present time of high temperatures should be drawing to an end…leading into the next glacial age”(47).
Let us all be sure that the global warming, climate change, polar ice cap melt problem does not exist in the way the media would like us to believe. A NASA 2013 study recorded that the “Antarctic ice sheet showed a net gain of 112 billion tons of ice a year from 1992 to 2001” and also said, “The good news is that Antarctica is not currently contributing to sea level rise but is taking 0.23 millimetres per year away”. Even though the net gain slowed to 82 billion tons of ice per year between 2003 and 2008(48) this is further proof that the global temperatures are not responsible for ice depletion because that depletion would be worldwide and not limited to the northern hemisphere. The polar bear decline in population scare is negated by Dr Susan Crockford, a respected zoologist when she explains in her video how this scare was not based on fact. Her understanding is further supported by science studies that have documented polar bear populations thriving and increasing in areas of sea ice loss(50). The media driven hoax has been bravely reported by great climate scientists and researchers who still have their personal integrity intact. Dr Don Easterbrook when he made his presentation to the Washington State Senate Committee on Climate Change(11). Dr Patrick Moore when he made his presentation to the US Senate Environment and Public Works Subcommittee, in which he also exposes the real agenda of Greenpeace(12). Ivar Giaever gave a speech at the Nobel Laureates meeting 1st July 2015 where he explains that the global temperature has been amazingly stable since 1880 and has only increased 0.3% during the last 135 years(13). John Casey the US leading expert in climate change also made a presentation of his findings to expose the global warming scandal in which he presents real facts in a real way that makes perfect sense. Particularly when he outlines the political and financial pressures brought down on anyone who tries to tell the truth(14). John Coleman makes numerous presentations of the fact that Global Warming is a hoax. He brings 60 years’ experience of weather prediction as a meteorologist that supports the integrity of the facts he presents(15).
These people are the top scientists in the field of climate change and global warming. They are all presenting cold hard facts to support their understanding of the hoax and why it is happening. I think we should listen to what these top experts are saying. We should understand the climate change hoax for what it really is and make sure the perpetrators of this scam do not get their way and succeed in killing the planet and its people by restricting the release of CO2. It is impossible for the warming of the air to heat the oceans or the Earth. Carbon Dioxide can’t cause global warming, this is explained by chemistry expert Dr Mark Imisides (Industrial Chemist). He explains how heat is transferred between air and water and how much heat is needed to raise the temperature of the ocean. We all know this to be true from our own experiences of life. You cannot heat a bath of water by putting an electric fire in the bathroom(16).
The sun goes through an 11-year cycle of varying heat production, but this small variation in output does not have the vast influence that the varying distance of the Earth from the Sun has over our climate, in accordance with the inverse square law of energy transfer (18). The distance of the Earth from the Sun is by far the greatest influence on the strength of energy received. The Earth does not circumnavigate the Sun in a perfect circle. The effects of this variation in distance can be seen every six months. During the month of January, the Earth is at its closest 146 million kilometres (Perihelion) during the month of July the Earth is at its furthest 152 million kilometres (Aphelion). This varying distance every 6 months is why the southern hemisphere experiences more extreme weather when compared to the northern hemisphere.
Everyone understands the procession of the equinox and how it is a 25,920-year cycle but Serbian mathematician and astronomer Milutin Milanković found other variations in our orbit. When he added all of the 3-dimensional variations of the Earth’s orbit together he found the full variation in distance of the Earth from the Sun. This understanding of the complete cycles of the earth became known as the Milanković Cycles. The Milanković cycles are responsible for the variations in our climate. When these cycles are considered in their entirety, they produce an overall variation in our climate that results in a 115,000-year cycle. We are just coming to the end of the warm period of this present cycle and the temperature of the Earth is set to rise by another 1-1.5 degrees before it goes into the next cold period. The Sun provides the heat for the Earth and the distance of the Earth determines the energy received, nothing else matters. The Earth receives more heat when it is closer to the Sun and the variations in orbit happen over a 115,000-year cycle and has nothing to do with CO2(17). This understanding has been supported by many studies from many avenues of science (21;22;23;24;25;26;27;28;29;30;31;32;33;34;35;36;37). The 115,000-year cycle is further confirmed by Oxford University when they studied the American mastodons, giant ground sloths, American camels, and giant beavers that made the migration south roughly 75,000 years ago from their warm “holiday homes” in the Arctic and Subarctic (39).
After considering the information in this article we can be sure that CO2 is a greenhouse gas and man emits it whilst burning oil based products. However, the effect of a 0.009% increase in CO2 added to the existing 1.8 W/m2 effect of CO2 radiative forcing has been exaggerated by inaccurate models. This article has shown CO2 is not responsible for any major disasters in the world or any of the bad things done in the name of progress. It has shown an unhealthy influence of the mainstream media over peoples understanding of the Global Warming problem and it has shown that the ideas being promoted in the media are misleading or false. It has also shown that no evidence exists proving CO2 as the driving force behind climate change but has provided insurmountable evidence supporting the understanding that the Earth’s temperature has a direct relationship to its varying distance from the Sun. This correlation has been proven many times by modern science and is therefore considered as sound evidence to show that the Milanković Cycles are a far larger driver of climate change than CO2. We must only rely on science that is based on facts and data and not decide the future on faulty models, consensus or sensationalised media articles.
References:-
1. Dr David Evans. Discovery will Change Climate Debate
19. Hertzberg, M. and Schreuder, H. (2016). Role of atmospheric carbon dioxide in climate change. Energy & Environment, 27(6-7), 785-797. Available from
20.Fortin, M.C. and Gajewski, K., 2016. Multiproxy paleoecological evidence of Holocene climatic changes on the Boothia Peninsula, Canadian Arctic. Quaternary Research, 85(3), pp.347-357. Available from
21. Lourens, L.J., Becker, J., Bintanja, R., Hilgen, F.J., Tuenter, E., Van de Wal, R.S. and Ziegler, M. (2010). Linear and non-linear response of late Neogene glacial cycles to obliquity forcing and implications for the Milankovitch theory. Quaternary Science Reviews, 29(1-2), 352-365. Available from
22. Meyers, S.R., Sageman, B.B. and Pagani, M. (2008). Resolving Milankovitch: Consideration of signal and noise. American Journal of Science, 308(6), 770-786.
23. Tziperman, E., Raymo, M.E., Huybers, P. and Wunsch, C. (2006). Consequences of pacing the Pleistocene 100 kyr ice ages by nonlinear phase locking to Milankovitch forcing. Paleoceanography and Paleoclimatology, 21(4). Available from
27. Wunsch, C. (2004). Quantitative estimate of the Milankovitch-forced contribution to observed Quaternary climate change. Quaternary Science Reviews, 23(9-10), pp.1001-1012. Available from
28. Shackleton, N.J. (2000). The 100,000-year ice-age cycle identified and found to lag temperature, carbon dioxide, and orbital eccentricity. Science, 289(5486), pp.1897-1902. Available from
29. Rial, J.A. and Anaclerio, C.A. (2000). Understanding nonlinear responses of the climate system to orbital forcing. Quaternary Science Reviews, 19(17-18), pp.1709-1722. Available from
30. Brathauer, U. and Abelmann, A. (1999). Late Quaternary variations in sea surface temperatures and their relationship to orbital forcing recorded in the Southern Ocean (Atlantic sector). Paleoceanography, 14(2) 135-148. Available from
32. Imbrie, J., Boyle, E.A., Clemens, S.C., Duffy, A., Howard, W.R., Kukla, G., Kutzbach, J., Martinson, 7., McIntyre, A., Mix, A.C. and Molfino, B. (1992). On the structure and origin of major glaciation cycles 1. Linear responses to Milankovitch forcing. Paleoceanography, 7(6), pp.701-738. Available from
33. Imbrie, J., Berger, A., Boyle, E.A., Clemens, S.C., Duffy, A., Howard, W.R., Kukla, G., Kutzbach, J., Martinson, D.G., Mcintyre, A. and Mix, A.C. (1993). On the structure and origin of major glaciation cycles 2. The 100,000-year cycle. Paleoceanography 8, 699e735. Available from
34. McIntyre, A., Ruddiman, W.F., Karlin, K. and Mix, A.C. (1989). Surface water response of the equatorial Atlantic Ocean to orbital forcing. Paleoceanography, 4(1), pp.19-55. Available from
35. Martinson, D.G., Pisias, N.G., Hays, J.D., Imbrie, J., Moore, T.C. and Shackleton, N.J. (1987). Age dating and the orbital theory of the ice ages: Development of a high-resolution 0 to 300,000-year chronostratigraphy 1. Quaternary research, 27(1), pp.1-29. Available from
36. HAYS, I.J. (1984). The orbital theory of Pleistocene climate: Support from a revised chronology of the marine δ^< 18> O record. Milankouitch and climate, NATO ASI Series, Series C: Mathematical and physical sciences, 126 269-305. Available from
39. Zazula, G.D., MacPhee, R.D., Metcalfe, J.Z., Reyes, A.V., Brock, F., Druckenmiller, P.S., Groves, P., Harington, C.R., Hodgins, G.W., Kunz, M.L. and Longstaffe, F.J. (2014). American mastodon extirpation in the Arctic and Subarctic predates human colonization and terminal Pleistocene climate change. Proceedings of the National Academy of Sciences, 111(52), 18460-18465. Available from
41. Raven, J., Caldeira, K., Elderfield, H., Hoegh-Guldberg, O., Liss, P., Riebesell, U., Shepherd, J., Turley, C. and Watson, A. (2005). Ocean acidification due to increasing atmospheric carbon dioxide. The Royal Society. Available from
(42) Maria-José Viñas, &. (2019). Wintertime Arctic sea ice growth slows long-term decline: NASA – Climate Change: Vital Signs of the Planet. [online] Climate Change: Vital Signs of the Planet. Available from
(44) Myhre, G., Highwood, E.J., Shine, K.P. and Stordal, F. (1998). New estimates of radiative forcing due to well mixed greenhouse gases. Geophysical research letters, 25(14) 2715-2718. Available from
(45) Haywood, J.M., Allan, R.P., Bornemann, J., Forster, P.M., Francis, P.N., Milton, S., Rädel, G., Rap, A., Shine, K.P. and Thorpe, R. (2009). A case study of the radiative forcing of persistent contrails evolving into contrail‐induced cirrus. Journal of Geophysical Research: Atmospheres, 114(D24). Available from
(47) Inhofe, J. (2003). The science of climate change. Senate Floor Statement. Chairman, Committee on Environment and Public Works, US Senate, July, 28.
(49) Robinson, A.B., Robinson, N.E. and Soon, W. (2007). En vi ron men tal Ef fects of In creased At mo spheric Car bon Di ox ide. Jour nal of Amer i can Phy si cians and Sur geons, 12, 79-90. Available from
(50) Rode, K.D., Regehr, E.V., Douglas, D.C., Durner, G., Derocher, A.E., Thiemann, G.W. and Budge, S.M. (2014). Variation in the response of an Arctic top predator experiencing habitat loss: feeding and reproductive ecology of two polar bear populations. Global Change Biology, 20(1) 76-88. Available from
The patently false notion of anthropogenic global warming (AGW) and climate change was first conceived of by the Club of Rome in its efforts to promote the need for population reduction based on the restricted availability of energy, under the guidance of a united worldwide government. The movement took root in October 1975 when Dr. Margaret Mead, president of AAAS, aided by associates Paul Ehrlich, Stephen Schneider, John Holdren and George Woodwell, held the “Atmosphere: Endangered and Endangering” conference in North Carolina where Mead used global warming caused by CO2 as the predicate for population reduction and eugenics. Subsequently, individuals in the United States fraudulently established and promulgated “carbon trading” institutions for purposes of levying taxes on those who purchase hydrocarbon based fuels. As a component of this scheme to initiate, mandate, and facilitate carbon taxes, the U.S. Environmental Protection Agency (EPA) was fraudulently induced to define Carbon Dioxide (CO2) as a “pollutant”; a ruling which was later upheld by the U.S. Supreme Court during litigation. The U.S. Congress attempted to hold hearings and issued subpoenas to the leaders of the EPA to investigate why CO2 was improperly defined as a pollutant. This resulted in outright lies, lack of responses, and the resignation of the Director of the EPA. The scientific community unknowingly and unwittingly aided and abided the deceit based on the computer generated hockey stick curve created by Dr. Michael Mann, et al, and first publically discredited by “MIT Technology Review” in October of 2004. Government published statistics show that $178 billion dollars of tax payer funds has been spent on direct climate change related technology, science, and funds given to other nations as a result of the climate change hoax, from 1993 to 2017. The government has systematically enabled the continuation of this fraud through billions of dollars spent annually by funding university research and government labs doing “climate research.” The false notion of AGW and/or man induced climate change has spawned tens of thousands of new businesses worldwide. The total Climate-Industrial Complex is a $2-trillion-per-year business. These companies are virtually 100% dependent on the politically driven notion of “dangerous manmade global warming and climate change.” The media, public, and political establishment constantly recite the assertion that 97% of scientists say the problem is real and manmade carbon dioxide (CO2) is the cause. However, increased concentrations of CO2 in the atmosphere do not lead to global warming and climate change. Carbon dioxide is a trace gas in the atmosphere. The major “greenhouse gas” is water vapor. An intricate feedback system regulates the Earth’s temperature, maintaining immunity from temperature increases and decreases due to such trace gases. The global warming hoax has taken root the world over. The United Nation’s IPCC along with the Club of Rome have become political bodies whose intentions are the restriction of energy avaliability, the reduction of population, and the establishment of a one world government institution. As a result of this reckless activity, millions of people’s lives will be negatively impacted, including a tremendous loss of life. This entire set of facts and their basis in fact must be brought to the attention of the vast majority of the American people and then to the people of all nations. The 2019 Democrat political party is making the false notion of climate change a principal issue, and the Republican Party is becoming more receptive to that position.
test_mcb8msPosted on 3:30 pm0 Comments
Funding the Climate-Industrial Complex
By Tom D. Tamarkin
Jan. 9, 2019
Why Big Green energy investors rely on the man-made global warming myth
Supposedly “green” or “renewable” energy has become a trillion-dollar-plus annual industry that has spawned tens of thousands of new businesses worldwide. The total Climate-Industrial Complex is a $2-trillion-per-year business. Major fossil fuel companies like Shell Energy now have green energy divisions.
These companies are virtually 100% dependent on the politically driven notion of “dangerous manmade global warming and climate change.” The media, public and political establishment constantly recite the assertion that 97% of scientists say the problem is real and manmade carbon dioxide (CO2) is the cause. (more…)
test_mcb8msPosted on 2:47 am0 Comments
Funding the Climate-Industrial Complex
By Tom D. Tamarkin
Jan. 9, 2019
Why Big Green energy investors rely on the man-made global warming myth
Supposedly “green” or “renewable” energy has become a trillion-dollar-plus annual industry that has spawned tens of thousands of new businesses worldwide. The total Climate-Industrial Complex is a $2-trillion-per-year business. Major fossil fuel companies like Shell Energy now have green energy divisions.
These companies are virtually 100% dependent on the politically driven notion of “dangerous manmade global warming and climate change.” The media, public and political establishment constantly recite the assertion that 97% of scientists say the problem is real and manmade carbon dioxide (CO2) is the cause.
However, increased concentrations of CO2 in the atmosphere do not lead to global warming and climate change. Carbon dioxide is a trace gas in the atmosphere. The major “greenhouse gas” is water vapor. An intricate feedback system regulates the Earth’s temperature, maintaining immunity from temperature increases and decreases due to such trace gases.
Furthermore, the false notion of CO2-driven climate change is responsible for the potential massive redistribution of wealth from now-wealthy industrialized nations to poor countries. This has led to the corrupt worldwide business of carbon tax credit trading and more money to fund wind, solar and biofuel energy. Green industries should not predicate their business models on false claims about climate change.
They should base their businesses and R&D budgets on the fact that fossil fuels will become less economically viable over the coming decades as easily recovered reserves are depleted. Renewables such as solar and wind cannot provide material amounts of energy required worldwide – and require vast amounts of metals and other materials that are themselves not renewable or sustainable.
Utilities and energy companies must be free to use petroleum, coal, natural gas and biofuels at market-demand costs and must increase nuclear energy production. New sources of high energy density power generation must be created.
Today the “green energy” or “renewables” sector of the power generation industry is driven by the perceived but not scientifically proven notion that carbon dioxide resulting from the burning of fossil fuels and bio-fuels cause “global warming” or “climate change.” This is based on incorrect ideas about the real practical effects that “greenhouse gases” cause when introduced into our atmosphere.
This illustrative chart shows that there is no causational relationship, either liner or logarithmic, between steadily rising CO2 levels and nearly stable to slightly higher average global temperatures over the past four decades which decreased in 2018 and is on a continued downward curve. The chart uses an expanded temperature curve to demonstrate this lack or correlation let alone causation.
Furthermore the water vapor content in the lower atmosphere varies from 100 PPM or .01% to 42,400 PPM or 4.2% – whereas carbon dioxide is ≈ 412 PPM or 0.04% of the atmosphere. That is over two orders of magnitude difference when water vapor is at its peak concentration. This suggests that water vapor has a much greater effect as a greenhouse gas than carbon dioxide. Water vapor and clouds account for 90% of greenhouse gas volume in the atmosphere.
It is theoretically possible that carbon dioxide and other non-condensable greenhouse gases like methane, nitrous oxide and ozone can create minute increases in thermal absorption and therefore could increase the amount of water vapor in the atmosphere via a “positive feedback cycle,” leading to warming and an increase in evaporation of sea water. However, the trace amounts of these gases would lead to virtually undetectable and immeasurable temperature and water vapor increases.
Moreover, adding more water vapor to the atmosphere would also produce a negative feedback effect. This could happen as more water vapor leads to more cloud formation. Clouds reflect sunlight and reduce the amount of energy that reaches the Earth’s surface to warm it. If the amount of solar warming decreases, then the temperature of the Earth would decrease.
In that case, adding more water vapor would result in global cooling, rather than warming. But cloud cover does mean more condensed water in the atmosphere, making for a stronger greenhouse effect than non-condensed water vapor alone. It is warmer on a cloudy winter day than on a clear one.
Thus the possible positive and negative feedbacks associated with increased water vapor and cloud formation will largely cancel one another out and further complicate the ability to model these feedback cycles using computer simulation and mathematical modeling.
Many in the “renewables energy” industry will object to this analysis, because they see it as undermining their reason to exist, affecting investor interest and sales opportunities. They miss the key point.
Today the only viable energy source beyond fossil fuels is nuclear fission. Our nuclear energy industry must be rebuilt if America is to remain a leader in energy, economic growth and opportunity. We must also continue our research and development in fusion energy which has many advantages over nuclear fission, if it is ever perfected.
We commissioned an objective science-based analysis of solar power as a means to generate 100% of baseload power in the USA based on current demand. The results are clear: solar power for baseload electricity is simply unrealistic. It is a virtual impossibility to power America from solar energy based on the science, let alone the economics, reliability or land and material requirements. Electrifying the transportation infrastructure will increase this impossibility several fold. The same is true of wind power.
We must develop the next generation of very high energy density nuclear power – first nuclear fission, to be replaced possibly by fusion in the mid to late 21st Century. We must also learn to conserve energy and materials better, not to save the planet from man-made climate change, but to give man more time to develop high flux density energy generation science and technology.
In December 2018, both Excel Energy and Northern Indiana Public Service Company (NIPSCO) announced plans to convert to 100% renewable green energy generation by 2050. That is a scientifically impossibility, unless policy makers and environmentalist alike redefine nuclear energy as green.
Why would they make such claims? For Excel boosting stock prices through subsidies comes to mind.
NIPSCO is a government-protected monopoly utility, with Indiana state government guaranteeing NIPSCO a profit of approximately 10% for every dollar it spends. That means NIPSCO has an obvious financial self-interest to engage in costly business practices. Building expensive new power facilities, even when existing facilities are working perfectly well, is one of the most effective ways for NIPSCO to ramp up its spending and guaranteed profits. Of course both companies do so at the expense of consumers, many of whom have no knowledge that their electricity bills are about to rise substantially.
Let energy buyers beware. Politicians, activist groups and industrialists are all using “climate change” to increase their power and income. We need to figure out what they’re doing – and fight back.
Tom Tamarkin has been involved with the utility business and energy since 1985. He is founder and president of EnergyCite, Inc, in Sacramento, CA and founder and GM of the Fusion Energy Consortium.
ccPosted on 11:38 am0 Comments
Absorbed solar radiation anomaly challenges the IPCC science
Dr. Antero Ollila
June 1, 2024
The warming spike in 2023 has caused extraordinary reactions among climate scientists but also comment that nothing unusual is going on and everything fits into the “natural variability” calculated by climate models.
Mika Rantanen and Ari Laaksonen, researchers at the Finnish Meteorological Institute, proved in their study (Reference 1) that September 2023 was the warmest with a difference of 0.5°C and that its occurrence is statistically very unlikely (in normal language impossible) to be caused by greenhouse gases. NASA administrator Gavin Schmidt acknowledged in his World View article in the journal Nature 19 March 2024 that in 2023, temperatures were 0.2°C higher each month than previous records and because greenhouse gases have been able to raise temperatures from 2023 only 0.02°C, ”perhaps we are in uncharted territory”. This statement was unexpected and extraordinary expressed by the firm supporter of the IPCC science.
My study titled “The 2023 record temperatures: correlation to absorbed shortwave radiation anomaly” was published on 25 April 2023 in the journal Science of Climate Changes and shows that the cause of warming in 2023 after the temperature pause from 2015 onwards, is fully known and can be verified based on satellite measurements.
My research shows that the IPCC does not accept the shortwave radiation values measured in its report AR6 in its warming calculations, but calculates that the resulting warming is caused by greenhouse gases only, i.e. makes a double error. I showed that behind this climate science lies the wider problem of computer models, namely the positive feedback of water, which leads to the temperature values of computer models escaping far too high.
The absorbed solar radiation anomaly (ASR) has increased from 2001 to 2023 total of 1.81 W/m2, which is about the same as the radiative forcing (RF) value of the carbon dioxide in the AR6 in 2019. The IPCC and the leading climate researchers have not recognised the ASR even though it is based on direct satellite observations of the CERES satellites operated by NASA.
The admittance of the ASR value of 1.81 W/m2 would mean a temperature impact of 0.85°C according to the IPCC science. If this value is added to the last warming value of 1.27°C in the AR6, the warming value would be 2.12°C. This value would alert also the media about the validity of climate models. It would raise questions about the water feedback issue and the radiative forcing value of carbon dioxide of 560 ppm concentration: 3.93 W/m2 of the AR6 and 2.4…2,6 W/m2 reported by contrarian researchers.
Climate researchers have continued to study the trend of the Earth’s Energy Imbalance (EEI) as an explanation for increased ASR even though its accuracy issue is much more challenging than the ASR measurement accuracy. Originally the EEI research studies were carried out to point out that the extra energy received through the ASR anomaly increase has gone to the deep ocean. Now this explanation passed away since the global temperature increased anyway. Climate researchers have no other choice than to continue this game that the ASR is not capable of increasing temperature. Not even we know that 99,97% of the energy of the Earth originates from the Sun. The official message of the IPCC is that climate change is anthropogenic and the natural causes may have only short-term impacts like La Nina.
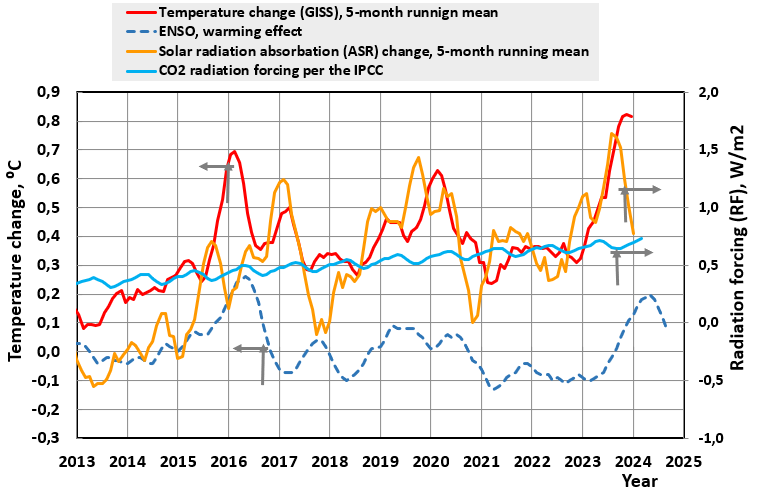
This figure depicts the global temperature (GISS), the ENSO temperature effect, carbon dioxide radiative forcing by the IPCC and the Solar Radiation Absorption (ASR) change according to the CERES observations by NASA. The temperature changes follow the ASR changes very well. ENSO temperature effects have about a 6-month delay on the global temperature. That is why the present La Nina temperature effects will have the maximum impact in May-Juni 2024 even though its maximum was in December 2023 and it can explain the exceptionally high temperatures of 2023 only partially.
The radiative forcing effect of carbon dioxide has been insignificant during 2013 – 2023 if compared to the ASR effect.
test_mcb8msPosted on 11:51 am0 Comments
UNSUPPORTABLE CLAIM: More than 99.9% of studies agree: Humans caused climate change
ITHACA, N.Y. – More than 99.9% of peer-reviewed scientific papers agree that climate change is mainly caused by humans, according to a new survey of 88,125 climate-related studies.
The research updates a similar 2013 paper revealing that 97% of studies published between 1991 and 2012 supported the idea that human activities are altering Earth’s climate. The current survey examines the literature published from 2012 to November 2020 to explore whether the consensus has changed.
“We are virtually certain that the consensus is well over 99% now and that it’s pretty much case closed for any meaningful public conversation about the reality of human-caused climate change,” said Mark Lynas, a visiting fellow at the Alliance for Science at Cornell University and the paper’s first author.
“It’s critical to acknowledge the principal role of greenhouse gas emissions so that we can rapidly mobilize new solutions, since we are already witnessing in real time the devastating impacts of climate related disasters on businesses, people and the economy,” said Benjamin Houlton, Dean of the College of Agriculture and Life Sciences at Cornell and a co-author of the study, “Greater than 99% Consensus on Human Caused Climate Change in the Peer-Reviewed Scientific Literature,” which published Oct. 19 in the journal Environmental Research Letters.
In spite of such results, public opinion polls as well as opinions of politicians and public representatives point to false beliefs and claims that a significant debate still exists among scientists over the true cause of climate change. In 2016, the Pew Research Center found that only 27% of U.S. adults believe that “almost all” scientists agreed that climate change is due to human activity, according to the paper. A 2021 Gallup poll pointed to a deepening partisan divide in American politics on whether Earth’s rising observed temperatures since the Industrial Revolution were primarily caused by humans.
“To understand where a consensus exists, you have to be able to quantify it,” Lynas said. “That means surveying the literature in a coherent and non-arbitrary way in order to avoid trading cherry-picked papers, which is often how these arguments are carried out in the public sphere.”
In the study, the researchers began by examining a random sample of 3,000 studies from the dataset of 88,125 English-language climate papers published between 2012 and 2020. They found only four out of the 3,000 papers were skeptical of human-caused climate change. “We knew that [climate skeptical papers] were vanishingly small in terms of their occurrence, but we thought there still must be more in the 88,000,” Lynas said.
Co-author Simon Perry, a United Kingdom-based software engineer and volunteer at the Alliance for Science, created an algorithm that searched out keywords from papers the team knew were skeptical, such as “solar,” “cosmic rays” and “natural cycles.” The algorithm was applied to all 88,000-plus papers, and the program ordered them so the skeptical ones came higher in the order. They found many of these dissenting papers near the top, as expected, with diminishing returns further down the list. Overall, the search yielded 28 papers that were implicitly or explicitly skeptical, all published in minor journals.
If the 97% result from the 2013 study still left some doubt on scientific consensus on the human influence on climate, the current findings go even further to allay any uncertainty, Lynas said. “This pretty much should be the last word,” he said.
test_mcb8msPosted on 5:51 pm0 Comments
Mother Nature organized a climate test showing 70 % error in the calculated 2019 temperature
The Earth receives 99.97% of its energy from the Sun. The global warming impact caused by greenhouse gases is calculated in such a way that it corresponds to the change in solar radiation at the top of the atmosphere and is called Radiative Forcing (RF). If the amount of solar energy changes, then the change in radiation power multiplied by the climate sensitivity parameter directly gives global warming effect. If the change had occurred in solar activity in a short period of time, it would be widely reported. When a change has occurred due to atmospheric conditions, scientists are not paying attention to the change, even though the result is exactly the same.
Sixteen climate change scientists, led by Nathan B. Gillett (later Gillett), published a study entitled “Constraining human contributions to observed warming since the pre-industrial period” in the journal Nature Climate Change (NCC) in March 2021, Reference 1.
The purpose of the researchers was to examine how the warming trend is taking place in relation to the Paris Climate Agreement, which aims to keep warming well below 2 °C. The temperature measurement has been Hadley Center/Climatic Research Unit Temperature – temperature series HadCRUT4. The researchers carried out temperature simulations by 13 General Circulation models (GCMs) with results in accordance with the Detection and Attribution Model Intercomparison Project (DAMIP) from the 1850-1900 average to the 2010-2019 average, which in this story has been named.
Figure 1. Human-induced temperature changes from 1850 to 1900 in 2010–2019. The average warming values for the period 2010–2019 on the right-hand side of the image have been estimated by the author from the graphs.
According to the study, the change in HadCRUT4 temperature during the study period was 1.1 °C and the warming caused by the anthropogenic factors was 0.9 °C to 1.3 °C meaning an average of 1.1 °C. The effect of anthropogenic factors consists of greenhouse gases from 1.2 °C to 1.9 °C (an average of 1.55 °C) and aerosols from -0.7 °C to -0.1 °C (average -0.4 °C). For the climate establishment (the IPCC and scientists supporting its climate change science), the results are excellent because the temperature calculated by computer models and the measured temperature are practically equal and support urgent measures to limit the Anthropogenic Global Warming (AGW), in line with the Paris Agreement.
The study does not consider the strong positive change in shortwave (SW) radiation since 2000, which affects the warming calculated by the models. This finding also leads to another observation that the positive water feedback commonly applied in computer models causes a significant error in the warming calculated by the models. All this questions the scientific climate models of the IPCC, which are the basis of the Paris Agreement. There is one conflict in the study between graphical representation and the numeric values of the text.
I briefly summarized these findings and conclusions and submitted it to Nature Climate Change, but refused they refused to publish it on the grounds that “we are not persuaded that these points advance or clarify understanding of the paper”. This argument means that the NCC did not deny the accuracy of my findings, but they did not want to give them publicity because it would bring Gillett’s research into a negative light. I published my findings in another paper in an extended form, Reference 2.
In my short research paper, I highlighted three flawed points in the Gillett study, and I added the fourth point concerning the Paris Agreement. I have used two simple computer models, the IPCC model and mine (the Ollila model), which have the same basic structure for calculating the essential results of Gillett’s study.
Simple climate models
The warming values for any radiative forcing (RF) can be calculated using the following IPCC equation.
dT = λ * RF (1)
where dT is a global surface temperature change (K or °C), λ is a climate sensitivity parameter (K/Wm-2) or (°C/Wm-2). The climate sensitivity parameter λ used by the IPCC is 0.5 K/(W/m2), which means positive water feedback, and it is valid even for the scenario RCP8.5, where the equivalent carbon dioxide concentration is 1370 ppm CO2 in 2100. For example, according to equation (1), transient climate sensitivity (TCS) is 0.5 * 3.7 = 1.85 ⁰C, according to IPPC. It can be compared with the IPCC’s official TCS value of between 1.0 °C and 2.5 °C, meaning an average of 1.75 ⁰C. According to the last AR5 report of the IPCC, the TCS value in Table 9.5 calculated by 30 computer model is 1.8 ⁰C.
Since it turned out that Gillett’s simulations did not used the SW radiation anomaly, I have used my own simple climate model, which does not have a positive water feedback, but has a λ value of 0.27 K/(Wm-2).
I have used the RF values in the IPCC from the Assessment Report AR5, where RF values are grouped into three main groups, like Gillett’s research, and in 2011 they were from 1750 to 2011:
Greenhouse gases 3.18 W/m2 ~ 1.58 °C – Aerosols, the impact of aerosols on clouds, and land use -0.97 W/m2 ~ 0.49 °C
Change in solar radiation intensity (natural causes) +0.05 W/m2 ~ 0.03 °C
Total 2.26 W/m2 (The IPCC reports 2.29!) ~ 1.15°C
Gillett’s warming value is slightly higher than the IPCC estimate in the AR5, but they have compared the warming, from 1951 to 2011. When the warming of the AR5 is calculated from 1750 to 2011, it is 0.5 * 2.29 = 1.15 °C.
The IPCC’s RF values for greenhouse gases since 2011 can be found on NOAA’s website, where is the AGGI file (The Annual Greenhouse Gas Index), Reference 3.
I have used a temperature change in my validation calculation between 2001 and 2019 and in my model, I have considered only the change in CO2 content as the impact of other greenhouse gases in this short term is nil:
RF = 3.12 * ln(C/280), (2)
where C is the CO2 concentration (ppm).
Both in the IPCC model and in my model, the temperature effect of the ENSO (El Nino Southern Oscillation) effect has been calculated using the Oceanic Nino Index (ONI index):
dT = 0.1 *ONI (3)
A six-month delay has been applied in equation (3).
The conflict between text and graphical representations
In the text of the study, Gillett states that the average warming caused by anthropogenic factors during the study period is 1.1 °C (brown graph) due to zero natural forgings (change in solar radiation). According to the graphical representation as shown in Figure 1, the total warming value is approximately 0.8 °C, which is the sum of greenhouse gases of 1.3 °C and the aerosols of 0.5 °C. Similarly, the HadCRUT4 temperature value for the study period is approximately 0.8 °C. The temperature value of 1.1 °C appears to be the 2019 value in both cases. I can’t find an explanation for this difference in the study.
The warming effect of the radiative forgings of aerosols and clouds
The most significant flaw in the study is the warming effect of aerosols, which is the lowest blue line in Figure 1. Its value has fallen to -0.5 °C around 1980 and has remained the same until 2019. This value can be compared to the AR5’s RF value of 0.97 Wm-2 in 2011 and it can be concluded that it is the same, i.e. 0.5 * 0.97 = 0.5 °C.
Based on Gillett’s graphical presentation, the effect of aerosols has been at -0.5 °C since 1990. There are several studies that show, based on both ground stations measurements and satellite observations, that Earth’s darkening turned to brightening around 1985-90. Brightening means that more solar radiation comes to the Earth’s surface. The decisive direct measurement evidence has emerged from the measurements of CERES satellites, which became available in March 2000. The CERES satellites measure total solar radiance and upward reflected shortwave radiation SWup. The difference of these radiation fluxes is the SW radiation downwards SWdn, which is the same as the net Earth’s energy received from the sun, about 240 Wm-2, Figure 2.
Figure 2. Shortwave radiation trends SWup and SWdn since March 2000. The temperature effects have been calculated according to the IPCC simple model equation (1), which uses positive water feedback.
The effect of the change in SW radiation SWdn from 2000 to 2019 is approximately 0.6 W/m2, corresponding to a temperature change of 0.3 °C. If this effect is added to Gillett’s value, the total temperature change would be between 1.2 °C and 1.6 °C. It is worth noting that the SWup reflected into space depends on all the factors that affect the SW radiation penetration and reflection of the atmosphere, clouds, and the Earth’s surface. Gillett’s research does not consider the change in SWdn at all, although it has been 1.61 W/m2 in 2019 – almost the same as carbon dioxide’s RF of 1.68 W/m2 from 1750 to 2011.
It should be noted that the change in SWdn has been addressed only in a few publications, References 2, 4, 5. That is why some people have been skeptical as to whether I have been able to calculate this SW radiation change correctly, because CERES data does not give a radiation value to SWdn directly, but it must be calculated by eliminating seasonal variation, reference 6. Norman Loeb is the director of the CERES program, and his last study (Reference 5) has a graphic representation of this SWdn trend, Figure 3.
Figure 3. Change in the SWdn radiating to the Earth in 2002-2020.
Figure 3 shows that the trend of SWdn radiation that I have used is the same as that used by Loeb et al., but there are two differences. Since CERES data starts in March 2000, SW radiation can be reliably calculated from September 2000, but Loeb et al. have started to use from 2003 onward. For some reason, Loeb et al. has scaled this change so that it does not start from zero, giving an average difference of -0.6 W/m2 to my radiation value.
Positive water feedback in climate modeling, validation
The term “radiative forcing” is not found in Gillett’s research, but it is an essential feature of the climate models used by the IPCC. Positive water feedback, which doubles the value of other radiation forcings, is a basic feature of all climate models approved by the IPCC. The existence of this feature in the 13 climate models used by Gillett can be tested using carbon dioxide, which has the best-known RF according to the AR5 (very high confidence). In 2019, according to Gillett’s simulations, the warming effect of carbon dioxide was 1.0°C (the graphical presentation of supplementary information), Figure 4.
Figure 4. The global warming effect of carbon dioxide, according to Gillett.
If positive water feedback has been used for CO2, the warming value shall be obtained according to formula (1) using the “canonic” formula of Myhre et al. for CO2: RF = 5.35 * ln(C/280)
dT = 0.5 * 5.35 * ln(411.16/280) = 1.03 °C (4)
This proves that the climate models used by Gillett have used positive water feedback and the same values can be calculated using the simple IPCC climate model, equation (1).
Validation means testing whether the result calculated by any model corresponds to the value observed in the nature. The warming result of 1.1 °C calculated by 16 GCMs by Gillett for the study period, but the models do not consider a change in SWdn that would increase the temperature calculated by the models by 0.3 °C. Since the error is the average for the 2010-2019 period, it does not look too great, but the 2019 error is already an enormous +0.8°C. This error will be realized in the simulation of the temperature change over the period 2001-2019 using the IPCC model and my own model, Figure 5.
Figure 5. Temperature changes were calculated using the IPCC model and the Ollila model in 2001–2019 compared to HadCRUT4. An essential difference is the positive water feedback in the IPCC model.
In the IPCC model, the change in 2019 is due to three factors: greenhouse gases 0.29 °C, ENSO effect 0.08 °C and SW radiation change 0.8 °C meaning a total change of 1.17 °C. In my model, the corresponding changes are greenhouse gases 0.1 °C, ENSO effect 0.08 °C, and shortwave radiation 0.37 °C, meaning the total of 0.55 °C. HadCRUT4 temperature change was 0.39 °C. If Gillett’s calculations had taken into account the change in SWdn, the temperature change for 2019 would have increased from 1.1 °C to 1.9 °C, which would mean an error of approximately 70 percent.
Scientific criteria for the Paris Agreement on climate change
The scientific calculations of the Paris Agreement are based on IPCC science and the base scenario has been the very unlike or even impossible scenario RCP8.5, which has been used for calculating anthropogenic temperature changes in the future. The purpose of the Paris agreement is to limit warming to a maximum of 2.0 °C and preferably to keep it at 1.5 °C.
When the change in SW radiation is considered in the calculations, according to the IPCC models, the temperature increased to 1.9 °C in 2019 which is 0.8 °C greater than the 1.1 °C calculated by Gillett using computer models. Because there is an error of about 70% in this value, it indicates that the positive water feedback is a wrong concept. The same positive water feedback also distorts the effect of anthropogenic factors.
Is this researchers’ unintentional mistake or a scam?
Researchers can make mistakes in their studies and their calculations can lead to the results not reflecting reality. It may also be a question of intentional falsification of research results, which can be classified into four different categories:
Falsification meaning intentionally falsified measurement or research results.
Artificial fabrication of measurement values and research results.
Copying measurement values and research results from other researchers and presenting them as their own results.
Selected use of measurement values and research results to support one’s own theory (cherry picking).
The latter case is the most common distortion of research results and one of the main tasks of peer reviewers is to ensure that this is not exploited in research study. In this case, Gillett has not the applied SW radiation values from 2001 to 2019 in 16 GCM simulations although it has a significant impact on the final result and shows that positive water feedback does not occur in the climate.
Since we are talking about professionals who follow the research results and observation data bases of climate change field closely, it is not credible that Gillett et al. would not be aware of any significant changes in the SW radiation since 2001. Publications have been made and measurement data are publicly available as CERES data, which are by far the best observational radiation data.
It can be estimated that, even in this case, scientists supporting IPCC science have support from the climate community. This can be seen, for example, in the fact that the peer reviewers of the article have not intervened in this apparent selection of measurement data, i.e. the omitted measurement data. One of the most respected publications of climate science namely Nature Climate Change has refused to publish criticism of the identified shortcomings. All this has to do with the development of a strong hegemony in climate change science that defends and supports anthropogenic global warming (AGW) theory. Different views and research results are silenced, and errors are masked. Hegemony means the cultural or political domination of a group in society.
Final comments
Why, is there a desire to cover up the surge in SW radiation? Firstly, by excluding the warming impact of SW radiation, the temperatures of 2010-2019 calculated by computer models can be brought into line with the measured temperatures. Secondly, it shows that the natural forcings may have strong temperature effects when the climate establishment has declared that these impacts are next to nil. Thirdly, considering SW radiation reveals that the positive water feedback used by the climate establishment leads to a significant error in relation to the measured temperature, as indicated by the year 2019.
I estimate that this study will have a significant impact on the IPCC report AR6 to be published in August. The previous report, AR5, covered up the fact that the IPCC radiative forcings for 2011 were 2.29 Wm-2, which means a temperature change of 1.15 °C, but the temperature change was only 0.85 °C according to the IPCC meaning the error of around 35%. By excluding the change SW radiation downward from temperature impacts, the GCM calculated temperature and the observed temperature for the reference years are likely to be almost the same. If contrarian comments do not appear or they can be pressed down, then the IPCC will not hesitate to use this matter in publication of the results of the AR6.
References
1. Gillett NP, Kirchmeir-Young M, Ribes A, Shiogama H, Hegeri GC, Knutti R, Gastineau G, John JG, Li L, Nazareno L, Rosenbloom N, Seland Ö, Wu T, Yukimoto S, Ziehn T, 2021. Constraining human contributions to observed warming since the pre-industrial period. Nat. Clim. Change, 11:207-212. https://www.nature.com/articles/s41558-020-00965-9.
2. Ollila A. Global Circulation Models (GCMs) Simulate the Current Temperature Only If the Shortwave Radiation Anomaly of the 2000s Has Been Omitted, 2021. Current Journal of Applied Science and Technology, 45-52. DOI: 10.9734/cjast/2021/v40i1731433.
3. NOAA, National Oceanic and Atmospheric Administration (NOAA), the Annual Greenhouse Gas Index (AGGI); 2021. Available: https://gml.noaa.gov/aggi/aggi.
Correlations of decrease in “average worldwide temperature” and volcanic activity are high.
Correlations of increase in “average worldwide temperatures” and El Niño events are high
Empirical measurements and calculations of the relative percentage of anthropogenic carbon dioxide in the total carbon dioxide reservoir are highly uncertain at best.
The total atmospheric CO2 concentration represented by the Mauna Loa, Hawaii Keeling curve shows an almost straight line degree of annual change from 337 ppm in 1979 to 408 ppm in 2018. The rate of change in annual anthropogenic global fossil-fuel carbon emissions is shown to be, in five year time frames, from 1979 to 1999, as follows; 1979-84 -89 %, 1984-89 +817%, 1989-94 +169%, 1994-99 +344%, 1999-2004 +1,197%, 2004-2009 +933%. This shows that the Keeling curve reflecting total atmospheric CO2 concentration is not materially affected by annual anthropogenic global fossil-fuel carbon emissions.
On March 19, 2020, the COVID19 related lockdowns took effect virtually worldwide. From the period of March 20, 2020 to March 20, 2021 there was a rough order 30% worldwide reduction in the use of hydrocarbon fuels across all energy sectors of residential, commercial, industrial and transportation. Yet on March 20, 2021 the Mauna Loa Keeling curve continued its rise to nearly 418 ppm. In other words, even with a massive reduction of worldwide fuel use, the CO2 trends recorded at Mauna Loa continued to rise in a slope undetectably different from that over the last 50 years.
II. Thesis and Premise
It is estimated that the worldwide annual costs associated with global warming and related alternative energy exceeds 2 trillion U.S. dollars. Countries worldwide are now taking actions or considering actions costing hundreds of billions, even trillions of dollars. However, Anthropogenic Global Warming (AGW) or human caused climate change has not been proven. Therefore the ability to falsify the anthropogenic theory of climate change has enormous financial and societal benefits with significant return on investment. Whereas studies involving the absorption of infrared light reflected from the Earth’s surface and then retransmitted to the Earth by so called greenhouse gases have been ongoing for many years, this scientific discipline has been unable to prove or disprove the degree to which anthropogenic processes are responsible for any AGW or climate change on the Earth. Since the primary mechanism of the speculated climate change is predicated on burning of fossil fuel sources by man which produces carbon dioxide gas, then a definitive means of determining the influence of man’s contribution, if any, to AGW or climate change is to accurately determine what percentage of the total amount of carbon dioxide resident in the Earth’s lower atmosphere results from burning fossil fuels worldwide. Given the dynamic and turbulent nature of the Earth’s “carbon system” involving the natural variabilities in carbon dioxide emission and absorption, the ability to mathematically derive the percentage of measured anthropogenic fossil fuel CO2 which is contributed to the Earth’s total reservoir of atmospheric carbon dioxide gas has been virtually impossible due to factors involving the variations within the carbon dioxide flux.
Therefore, given the current uncertainties of the atmospheric carbon dioxide components, a new means of measurement and/or computation of the anthropogenic component in the total atmospheric reservoir carbon dioxide reservoir must be developed.
III. Lecture (discussion)
A full video of the following discussion in this Question and Answer format is summarily provided as a YouTube based video. Click on the link after
1. There is much discussion about climate change. Does it exist?
The Earth is over 4 .5 billion years old. The Grand Canyon gives us a snap shot of 10% of that record. Think about that. Modern man is trying to use a 50 to 100 year time frame to show…if not prove…that manmade climate change exists! These trends are only .000001% of the Earth’s age!
Geological samples show that the Earth has been much warmer and much colder in the past and our current CO2 level is very low compared to the past. We can prove that the climate does change due to natural variations in solar and planetary motions, coupled with the almost 24 degree tilt of the Earth’s axis, its obliquity, its elliptical orbit around the Sun and its precession.
Other natural occurring events such as volcanic eruptions, meteor strikes, and atmospheric oscillations such as El Niño and La Niña create temporary changes in climate perhaps better sated as the weather.
However, we cannot empirically prove that greenhouse gases trapping heat causes measurable amounts of warmth on the Earth. All climate change predictions result from computer models based on the unproven theories of man. And so far all such predictions have been wrong.
All climate change predictions result from computer models based on the unproven theories of man. And so far all such predictions have been wrong.
2. What is the radiated greenhouse gas theory?
The Infrared Radiated Greenhouse Gas theory is based on the absorption of infrared radiation or heat reflected back from the earth by Greenhouse Gases such as water vapor, Carbon Dioxide, methane, and the like. In the mid-1800s my great grandfather, Sir Thomas E. Thorpe along with Henry Roscoe in the UK made the first accurate calculations of the amount of CO2 in the atmosphere.
Later that Century, Svante Arrhenius, John Tyndall and others proposed water vapor and Carbon Dioxide “trapped heat” in the air.
In the early 20ty Century, Max Plank developed our modern understanding of quantum mechanics and Karl Schwarzschild applied this understanding to Greenhouse Gases. They showed us why these gases behave the way they do.
These gas molecules do absorb infrared energy but they dissipate it very quickly…in ten thousand billionths of a second…or one femto second…transferring that energy to surrounding molecules mostly nitrogen and oxygen. Then that energy is radiated out in a three dimensional steradian pulse and most passes to outer space either directly or through convection.
Given the extremely low spatial density of Greenhouse Gases in the atmosphere, and given the velocity of light, coupled with the inverse square law, this radiated energy is very weak and is only on the Earth for a very short period of time; again measured in femto seconds.
No measurable corresponding increase of temperature can be measured on Earth. Any increase in the temperature of the atmosphere’s majority gases, nitrogen and oxygen, also rises to space due to pseudo-adiabatic expansion & convection.
3. You are saying that there is no measurable increase of the Earth’s temperature. Is that correct? What do you mean?
No one has empirically measured and proven any temperature increases on the surface of the Earth due to Greenhouse Gases These gases do delay cooling of the Earth at night. Without them it would get down to 100 degrees below zero by early morning. But again they create no measurable increase of the “world’s temperature.”
4. Some scientists, certainly the media, and many politicians say that this (perceived) climate change comes from man’s use of fossil fuels which emit carbon dioxide. What effect does CO2 have?
Carbon dioxide is a greenhouse gas; but a trace amount one, meaning that it accounts for only 0.04 % of all gases in the atmosphere and only 4% of all so called Greenhouse Gases. But we shouldn’t focus on Carbon Dioxide per se. We should focus on manmade Carbon Dioxide which is the whole premise of the climate change argument.
Contrary to popular belief and that of many scientists, the anthropogenic percent of Carbon Dioxide is so low in comparison to the total amount of Carbon Dioxide in the atmosphere, that it is virtually unmeasurable.
Note that over the last year the use of fossil fuels worldwide across all energy sectors dropped by as much as 30% due to covid19. But this major decrease in manmade Carbon Dioxide was not measured, and therefore not reported.
We have our website of ClimateCite dot com, a section titled “Our Position on CO2.” In the first few paragraphs we show conclusively that the CO2 measurements taken from Mauna Loa and other monitoring stations simply are not measuring manmade CO2. Material increase in Carbo Dioxide seen over the last 50 years are coming entirely from natural sources.
Dr. Murry Salby confirms this and explains the details in a lecture on our website. And Dr. Jamal Munshi, a leading statistician, shows that the likelihood of Carbon Dioxide increases affecting the temperature of the Earth is about as likely as you spotting a UFO after this interview.
5. So you are saying that the majority of the increases in carbon dioxide in our atmosphere measured over the last 50 years come from natural sources and not from man?
Yes. Carbon dioxide comes from two primary natural sources; animals and volcanic eruptions; animals being the larger of the two sources by far. All animals, including fish in the ocean produce Carbon Dioxide. Even bacteria on land produce Carbon Dioxide.
6. Why have we seen a steady rise of carbon dioxide over the last fifty years?
As I said earlier, the various CO2 monitoring stations are simply not sensitive enough to measure man’s contribution of Carbon Dioxide.
The primary reason we have seen a measurable increase in total Carbon Dioxide in recent times relates to the fact that we have been coming out of the little ice age over the last hundred years. People need to understand that the oceans contain 50 to 60 times more Carbon Dioxide than the atmosphere. This ratio is called the partition ratio governed by Henry’s law.
As the temperature of the oceans increase, more carbon dioxide is released by the oceans as a function of Henry’s law. This is a fundamental law of physics not; a theory. As water body temperatures go up; the CO2 levels in the air go up. Dr. Ernst Beck demonstrated in a 2006 paper that the curves cited by many geologists today imply far lower levels of CO2 over the past 1,000 years than actually existed.
7. In your opinion, how can this notion of anthropogenic or manmade climate change be put to rest once and for all?
Well, if I were a strong and honest member of the senate, Ted Cruz, as an example, and I wanted to end this debate once and for all, I would hold a Senate hearing and I would deliver an opening statement wherein I define the man warming debate as follows:
“Does manmade carbon dioxide coming from fossil fuels create warming or climate change?” “The answer to that question solves the issue once and for all.”
“Forget all the physics stuff about absorbed infrared radiation and heat transfer from “greenhouses gases” in the air to the Earth. That is too pedantic and people cannot evaluate it.”
“Look at the recent paper from Dr. Happer of the CO2 Coalition which is posted on our website. You have to have masters degree in physics…if not a Ph.D. …to understand it. But the issue can be boiled down to “Does manmade carbon dioxide cause warming or climate change?” Period.
Notice I did not say: “does carbon dioxide cause global warming.” I said: “does manmade carbon dioxide cause warming or climate change?
With numerous scientists present in the room along with all the left aisle types, I would ask one simple question: “What percentage of the total amount of Carbon Dioxide in the atmosphere is manmade coming from fossil fuel use?
Answer that question definitively.” When all the professor Michael Mann cronies speak up and say look at the Mauna Loa curve, I would ask: “Can anyone here empirically and mathematically prove that curve represents increases from anthropogenic Carbon Dioxide?” There would be total silence and then a lot of posturing and “…Sir, we need to study that…”
8. Has the anthropogenic carbon dioxide in the atmosphere been empirically measured using scientific instruments and advanced calculation techniques?
No. Not yet. The spectrometry or measurement equipment used today to measure Carbon Dioxide levels has to operate at the very limits of its resolution in what we call a non-liner range. Furthermore the signal to noise ratio is too great to resolve man’s CO2. We can detect seasonal variations in Northern and Southern Hemisphere plant growth but that is it.
The following expands the Q&A video discussion based on the scientific work product of Clair (Bud) L. Bromley, co-inventor along with Tomer (Tom) Tamarkin of a patent pending titled “A Preferred Means to Calculate Ratio of Anthropogenic Carbon Dioxide Produced by Human Combustion of Fossil Fuels Relative to Earth’s Measured Carbon Dioxide Atmospheric Reservoir.”
Since the amount of CO2 contributed by humans to the atmosphere is too small to be measured by infrared instrumentation and statistics, it is also too small to significantly affect climate change, or global warming or cooling.
The average net global concentration of carbon dioxide gas (CO2) in the atmosphere is routinely sampled and measured by longwave infrared radiation (LWIR) scientific instrumentation at laboratories such as the laboratory of the U.S. National Oceanographic and Atmospheric Administration (NOAA) on Mauna Loa volcano on Hawaii Island in Hawaii, USA. The laboratory results are reported with high accuracy and precision resulting in high confidence in these data, including formation of national and international policies and law and consequent costs to taxpayers and economies measured in billions or trillions of dollars.
The average net global concentration of CO2 measured in these labs is on the order of 400 molecules CO2 per one million other air molecules based on volume (ppmv). Four hundred (400) ppmv is 0.04 percent of the atmosphere. Air samples are taken multiple times per week in flasks. The air samples are dried to remove water vapor in the samples. Water vapor is the dominant greenhouse gas in the environment since water vapor also absorbs LWIR and is 10 to 100 times more concentrated in air than CO2. Also, the specific LWIR wavelengths which are absorbed by water vapor gas overlap with the wavelengths which are absorbed by CO2 gas. In combination, the higher concentration of water vapor and its overlapping absorbance wavelengths prevent routine measurement of CO2 gas concentration in ambient air by LWIR scientific instruments in laboratories.
The concentration of atmospheric CO2 gas at 400 ppmv or 0.04% is technically defined as a trace gas, along with the other atmospheric trace gases that collectively make up less than 1% of the atmosphere. When the air samples are dried and water vapor is removed, 400 ppmv is near the lower limit of detection but still within the lower limit of quantitation by LWIR detection and routine sampling. According to the data description provided by NOAA, detection is in a “non-linear” range requiring frequent and diligent calibration with validated CO2 gas standards in known concentrations.
The theory of human-caused global warming assumes that CO2 causes “greenhouse” warming by absorbing specific wavelengths of LWIR emitted from earth’s surface and then that CO2 re-emits that same radiation into the atmosphere. As occurs with undried air samples in the laboratory, most of the LWIR emitted by the earth is absorbed by water vapor gas in the atmosphere. The atmosphere also contains water aerosol and water droplets in clouds and fog and these forms of water also absorb LWIR. As occurs with undried air samples in the laboratory, the amount of LWIR in the atmosphere which is available to be absorbed by CO2 is small, obscured and limited because the LWIR already has been absorbed by water vapor, clouds and fog, water aerosol, etc.
According to the theory of anthropogenic or human-caused global warming (AGW), atmospheric CO2 absorbs LWIR emitted from earth’s surface and then re-emits that LWIR into the air, where part of the LWIR is radiated back to earth’s surface, part of that re-emitted LWIR is absorbed by water vapor and clouds or other greenhouse gas molecules, and part of that LWIR is radiated back into outer space. Thus, according to AGW theory, there is a feedback loop of LWIR radiative emission from atmospheric CO2 gas which causes increased warming of earth, water vapor and clouds, and the claimed result of this is a dangerous spiral of global warming that some believe is an existential crisis for humanity and most life on earth.
Since 400 ppmv of 0.04% CO2 is near the lower limit of detection and barely measurable by LWIR detection when water vapor is removed from the air samples (i.e., dried samples), then LWIR both to and from 400 ppmv concentration CO2 in natural air will be absorbed by water vapor, clouds, fog, aerosol, water droplets, etc. CO2 in natural air may absorb a marginal residual of LWIR from earth that escapes absorption by water vapor, but the amount will be small and obscured from measurement by large variance in more concentrated water vapor. CO2 in natural air may also absorb LWIR emitted by water vapor molecules and the amount absorbed by this route is probably higher than the amount absorbed by CO2 directly from earth’s surface. The AGW hypothetical feedback loop is probably the reverse direction proposed by AGW. In any case it is logically obvious that the amount of LWIR available to be absorbed by CO2 at 400 ppmv is exceedingly small because the radiation already has been absorbed by water vapor.
Re-emission of LWIR by greenhouse gas molecules occurs upon collision of the gas molecules. Radiative emission of a gas molecule occurs in a pulse of one wavelength duration at the same wavelengths and frequencies that were originally absorbed by the gas molecule. The pulse of LWIR is emitted into 3-dimension steradian space, analogous to the surface of a rapidly expanding balloon. The amount (intensity, or abundance watts per square meter) of the LWIR radiative emission is distributed into 3-dimensional space. The amount of LWIR absorbed at each subsequent event is reduced in proportion to the solid geometry steradian coefficient and reduced in proportion to the inverse square of the distance between the emitting molecule and absorbing molecule. The wavelengths and frequencies of the radiative emission do not change. Absorption of LWIR by a greenhouse gas molecule such as water vapor or CO2 is translated into increased internal vibrations among the atoms of the gas molecule. A fraction of a second after LWIR is absorbed, the molecule collides with another molecule or surface and then re-emits that same radiation into 3-dimensional space. Then the molecule relaxes to its ground vibrational state. This happens within nanoseconds or picoseconds. At each successive absorption, collision, and re-emission event by the next molecules the amount of radiative emission received and emitted is reduced. There is a downwardly spiraling crescendo.
CO2 molecules which absorbed LWIR emission from earth’s surface are saturated for a small window of time, probably nanoseconds, during which time they are transparent to LWIR radiation any source. Saturated molecules can absorb no more LWIR. LWIR from the earth’s surface and any other emission source is moving at near light speed passing transparently through all saturated CO2 and other greenhouse gas molecules. It follows that during daylight hours, all greenhouse gas molecules (primarily atmospheric water and CO2) are rapidly saturated, and then earth is emitting LWIR directly into space. By this process, earth is cooling to maintain energy balance with incoming solar sun radiation. After sunset, the greenhouse gas molecules emit their LWIR in the rapidly declining crescendo described above and continue to absorb and re-emit LWIR. The intensity of the LWIR from earth’s surface at night is declining as a function of time, so also LWIR available to be absorbed is declining in a cooling crescendo. But the delay in emission of earth’s LWIT into space due to the temporary absorption and emission of LWIR by greenhouse gases, primarily water vapor and clouds, when integrated over 24 hours results in earth’s troposphere being comfortably warmer than it would be without these greenhouse gases. Without these gases earth’s energy gained from the sun each day would be rapidly emitted by LWIR (heat) into space. Earth’s atmosphere is acting as a layer of insulation. This distribution of energy is a cooling process, not a warming process. LWIR (heat) is being distributed in incrementally lower and lower amounts. Watts per square meter declines at night and during daylight after the time around midday of maximum insolation.
Last and most important, the human portion of the 400 ppmv average net global CO2 concentration is significantly less than 400 ppmv, probably 40 ppmv or much less. The annual growth rate (or slope) of the NOAA average net global CO2 concentration is about 1.5 ppmv per year. LWIR radiative emission from a low concentration of human-produced CO2 concentration will be significantly less than from the 400 ppmv total CO2. Since detection of LWIR absorbance at 400 ppmv CO2 is completely obscured by water vapor, then water vapor would also block LWIR absorption by CO2 at 40 ppmv or less. Also, water vapor would absorb all LWIR radiative emissions from CO2 at 40 ppmv or less. Radiative emission from human CO2 cannot reach earth’s surface because it is absorbed by water vapor. Except during the hottest part of the day during maximum insolation when absorption by water vapor may be saturated, LWIR absorbance by human-produced CO2 is probably nil, because, as in the laboratory LWIR instruments, water vapor is absorbing the LWIR. Any amount of LWIR absorbed by water vapor due to feedback from radiative emissions of fossil fuel CO2 must be negligibly insignificant because water vapor is already blocking LWIR from reaching the human-produced CO2.
The logical conclusion is human-produced CO2 results in no measurable or significant warming nor cooling, nor radiative emissions, nor greening. As can be expected from the above analysis, diligent application of well-known statistical practices by Professor of statistics Jamal Munshi, PhD and other scientists can detect no statistical signal from fossil fuel CO2 emission in the NOAA LWIR CO2 dataset.
Other laboratory technologies have the capability of detecting 40 ppmv CO2 in natural, wet air, or even 4 ppmv or 1 ppmv CO2 in natural, wet air, for example gas chromatography, mass spectrometry, and Raman spectroscopy. Water vapor in natural atmospheric samples does not interfere with detection in these technologies. But that is beside the point. Radiation to and from CO2 gas is the same LWIR and physical phenomenon in the laboratory as in natural atmosphere. Whether in the lab or the natural undried atmosphere, LWIR is dominantly absorbed by 10 to 100 times more concentrated water vapor whose absorbance spectrum overlaps CO2’s absorbance spectrum. Since the LWIR absorbance from CO2 on the order of 400 ppmv concentration cannot be detected in natural, undried air, then the logical inference is a lower concentration of fossil fuel CO2 emissions cannot be absorbing or emitting significant amounts of LWIR in the atmosphere. Since human CO2 cannot be detected by routine, diligent LWIR science and statistics in the lab, then human CO2 cannot be causing global warming, cooling, climate change, melting glaciers, starving polar bears, bleaching coral, raising sea level, or social change.
9. What, if anything, are you doing to solve this problem and answer this question once and for all?
I am currently working with a team of scientists and mathematicians who are developing a means to solve the signal to noise ratio problem, and empirically measure man’s CO2 contributions. We do this using a technique called Quantum Resonance Interferometry… or QRI… which is described on our website.
As mentioned above we have filed for a patent and have international patent pending status now on our “A Preferred Means to Calculate Ratio of Anthropogenic Carbon Dioxide Produced by Human Combustion of Fossil Fuels Relative to Earth’s Measured Carbon Dioxide Atmospheric Reservoir.”
We are currently in the feasibility study stage and should have a moving forward plan by mid-June 2021. Our goal is to have initial results for peer review and publication by Q3, 2022.
Climate Dynamics: The True Control Knob of Climate Change
by Jim Steele | March 27, 2021
The earth’s energy equilibrium is determined by the balance between incoming solar radiation versus radiative cooling that emits infrared radiation back to space. Water vapor primarily and CO2 can slow radiative cooling via the greenhouse effect. I am most grateful for the greenhouse effect. Without it the earth’s average temperature would hover near 0°F instead of our currently more livable 59°F. But in addition to any radiative effects, the earth’s global average temperature is determined by a variety of climate dynamics, such as the balance between ocean heat storage and heat ventilation. This is well established as climate scientists attributed the slowdown in 21st century global warming was due to increased ocean heat storage associated with a period of more La Ninas. Warming in the northeast Pacific Ocean, famously known as the blob, was not caused by added heat, but by reduced winds that ventilated less heat than normal. Cloud dynamics are also important. Clouds can warm the nights and cool the days. Although increased cloud cover can slow the loss of outward‑bound infrared radiation, clouds also block sunlight to cause more cooling. Modeling studies have shown cloud cover trends are more closely related to decadal variability, and dynamics such as the Pacific Decadal Oscillation, than to any greenhouse gas induced warming.
Changes in land surface conditions are another critical dynamic. For example, given the exact same amount of incoming heat, dry soils will increase surface temperatures twice as fast as moist soils. As expanding human populations drained wetlands, and increasingly shunted rainwater into storm sewers, drier soils have caused abnormally higher temperatures during normally occurring droughts and heat waves. Unfortunately a myopic focus on CO2 hasled to downplaying the vital importance of how climate dynamics affect the global average temperature. But climate dynamics not only offer the best explanation for regional weather extremes, climate dynamics alone can account for 150 years of the earth’s average warming.
Consider that the polar regions are much warmer today than what the physics of radiative heating and cooling would predict. Polar regions should be much, much colder than they are today because they radiate more heat back to space than is absorbed by the sun and the greenhouse effect combined. The dynamic transport of heat from the tropics via ocean and air currents provides the added Arctic “warmth” that’s observed today. While winter temperatures (January) at north pole vary from ‑45°F to ‑15°F, the south pole winter temperatures vary between ‑80°F and ‑67°F. The south pole is so much colder because it is relatively shielded from the warming dynamics of ocean heat transport as well as its higher elevation.
Scientists have noted the warming effects of warm ocean currents travelling poleward to the Arctic for over 100 years. Winds extract heat from the warm poleward bound Gulf Stream and North Atlantic Current and carry that heat across the Atlantic to increase northwest Europe’s temperatures by 9-18°F. Thus it is the strength of those winds which is moderated by the North Atlantic Oscillation, and the volume of heat carried by the ocean currents that are the dynamics determining changes in the average European temperature.
With comprehensive modern measurements, researchers now estimate that inflows of warm Atlantic water “carry enough heat, if released, to melt the Arctic sea ice many times over”. However, when that warm Atlantic water reaches the Arctic Ocean, most sinks below 300‑foot depths due to its greater density caused by its higher saltiness. The dynamics of an overlying layer of fresh water and the thickness of insulating sea ice determine how much of that intruding Atlantic heat radiates back to space. Between 1950 and 1990, air temperatures exhibited a cooling trend over the western Arctic Ocean where insulating sea ice remained intact and inhibited the ventilation of stored heat. The lack of warming suggested no greenhouse effect.
Such complex interplays of climate dynamics can result in abnormally high Arctic temperatures without a contribution from the greenhouse effect. Yet that “Arctic amplification” biases the global average temperature upwards when then incorrectly gets attributed to rising CO2. Unfortunately as Mark Twain warned long ago, “All colleges have two great functions: to confer, and to conceal, valuable knowledge”. Accordingly despite copious published science by “climate dynamicists”, many scientists protect their pet theories and promote a manufactured CO2‑driven “climate crisis” while downplaying the competing importance of natural climate dynamics. I have university colleagues who teach “global warming policy” without having examined the underlying science. They just blindly trust the crisis narrative. Likewise most journalists and politicians lack the needed scientific background and simply perpetuate the narrative because both profit from promoting crises. As a result, climate science is suffering, and the dynamic control knob of climate change gets veiled from the public.
NASA: Temperature trend 2000–2009, showing strong arctic amplification
Winter Weather
The 2021 cold snaps that caused so much misery in the central USA and Europe exemplify the power of climate dynamics. Although Dallas, Texas normally experiences 60°F in mid‑February, temperatures fell by over 50°F to a low of 4°F with the day’s highest temperature only reaching 14°F. This obliterated the 1909 record low of 15°F and day’s record-low maximum temperature of 31°F. But such cold was not unprecedented. In three of the last 40 years Texas witnessed temperatures drop 50°F below normal. It should be noted, there was no compensating 50°F warming in the Arctic. Coincidentally the United Kingdom recorded -9°F, its coldest February night since 1955, while much of Germany saw temperatures fall below -4°F. The greenhouse effect can neither cause nor prevent such widespread devastating cold.
Record‑breaking cold snaps contradict CO2 warming theory. As one climate scientist published, “The recent perceived prevalence of cold waves, exacerbated by heightened media attention to each event, is at odds with a rather obvious first-order hypothesis: a warming climate should lead to warm extremes getting warmer, and cold extremes getting less cold”. Accordingly in the 1990s, climate scientists who promoted global warming argued rapidly warming temperatures during the winter were evidence of a stronger greenhouse effect. But their theories failed to explain the colder weather episodes.
A different hypothesis is proving to be more robust. Instead of arguing a warming climate causes fewer cold snaps, climate dynamics flips cause and effect; fewer cold snaps will increase averaged regional temperatures. Climate scientists published, “Like many places, Canada is not warming, it is just getting less cold.” Indeed, while many maximum temperatures have decreased since the 1930s, the increase in average land temperatures has been due solely to higher minimum temperatures,. Appropriately, regions with rising average temperatures have experienced fewer cold snaps. In contrast, due to the dynamics of quasi‑stationary planetary waves, cold snaps remain common over other regions. In much of the southeastern USA, temperatures have failed to exhibit any warming trend in the past 70+ years, despite urban warming effects. Such regions are classified as warming holes because they fail to exhibit the warming trend predicted by rising CO2.
Heat waves and cold snaps, floods and droughts, are often a function of planetary “waveguides” that shepherd the movements of cold and warm and moist and dry air masses. If there were no continents the “ideal flow” of the polar jet would be in a relatively straight‑line from west to east. The polar jet stream’s strong westerly winds would more readily restrict cold air masses to the polar regions. But due to the high- and low-pressure systems generated by the contrasting temperatures between land and sea, as well as flow altering mountain barriers, the “ideal zonal flow” is disrupted. In combination with the earth’s rotation (Coriolis effect), those disruptions impart a waviness to surface winds and the jet stream. The screenshot below (from https://earth.nullschool.net/) shows the waviness of the jet stream (at 500 mb) on March 25, 2021. The sharp color change reveals the boundary of the cold air which can be thought of as the equatorward limit of the polar vortex.
Cold Arctic air moves towards the equator via the wave troughs while the wave ridges allow warm air to intrude poleward. Due to an extreme trough in February, cold Arctic air reached down through the Great Plains into southern Texas. Due to a somewhat stationary planetary “waveguide”, such a wave trough is most often located between the Rocky Mountains and the Appalachians. That pattern also enables descending cold Arctic air to collide with warm air from the Gulf of Mexico to create Tornado Alley. The same trough dynamics that brought the Texas/Oklahoma cold snaps, brings the world’s highest frequency of tornados to the same region. The focus of that trough will shift with the seasons and over decades. As a result tornado activity is decreasing throughout the southern and northwestern portions of the Great Plains and the northern Midwest but increasing throughout the Southeast and southern portion of the Midwest. Decreasing tornado activity contradicts greenhouse warming predictions but is best explained by the dynamics of natural planetary wave motion.
In contrast, when a less wavy jet stream confines the cold air to the polar region, warmer southern air moves further poleward. Due to such a dynamic, Siberia endured a heat wave from January through May of 2020. At Verkhoyansk, Russia the typical maximum January temperature reaches -44°F, rapidly rising 90°F to an average high of 50°F in May as summer sunshine increases. The heat wave caused monthly temperatures to exceed normal temperatures by 10.8°F . Nonetheless, a Siberian heatwave which raises May maximums to just 61°F shouldn’t be hyped as the “earth on fire”, and I suspect any warming in January would be greatly appreciated. Yet, with the science of climate dynamics obscured, any extreme weather event gets deflected as CO2‑driven “weather weirding”, even though natural climate dynamics provide robust scientific explanations.
Both the Texas cold snap and the Siberian heatwave are the result of changes in the strength of the polar vortex. The vortex and waviness of the jet stream are largely moderated by oscillations in the quasi‑permanent Aleutian Low pressure system, which also regulates changes in the western Arctic sea ice. The Aleutian Low strengthens in the winter and weakens in the summer and its winter-time strength is further moderated by El Nino/La Nina dynamics and the closely related Pacific Decadal Oscillation. Media journalists prefer to avoid explaining the complexity of those basic climate dynamics, because simplistic explanations that are dumbed down are an easier sell. Thus natural climate change remains ambiguous to most people and that’s a problem.
In the 1990s, scientists and environmental groups pushing a CO2‑driven “crisis” hyped decades of the rapidly warming temperatures in Alaska as the fastest warming region on earth. Unexpectedly, Alaska suddenly flipped to become the fastest cooling region. Climate scientists observed, “During the first decade of the 21st century most of Alaska experienced a cooling shift.” Such a shift was inconsistent with the rising CO2 theory, but again easily attributed to the dynamics associated with “a change in the sign of the Pacific Decadal Oscillation (PDO, see graph below).
When the PDO is positive, the Aleutian Low strengthens, and its counter‑clockwise circulation drives more warm air into Alaska and drives more warm water through the Bering Strait increasing sea ice melt. When the PDO turns negative, it weakens the Aleutian Low, reducing the warm air flow into Alaska, so Alaska cools. A weaker Aleutian Low also reduces its disruption of the jet stream which allows the vortex to strengthen. The power of the ~30‑year cycles of the PDO was first recognized in 1997 as scientists noticed it coincided with changing ocean currents and changing productivity of salmon between the Gulf of Alaska and Oregon. The increasing understanding of natural PDO fluctuations has led climate scientists to argue that the “natural internally generated changes in atmospheric circulation were the primary cause of coastal Northeast Pacific warming from 1900 to 2012”.
Pacific Decadal Oscillation index (PDO) 1900-2020 data: http://www.atmos.washington.edu/
Summer Weather
When summer arrives in the northern hemisphere, the contrast between colder land and warmer oceans is reduced causing the Aleutian Low to weaken. The growing summer heat causes warmer lands to now contrast with cooler oceans which causes the high‑pressure systems in the northern hemisphere to strengthen in the subtropical Pacific and Atlantic (Pacific or Hawaiian High and the Bermuda or Azore High). These high‑pressure systems block moist ocean winds from bringing summer rains to the west coast of California and the Mediterranean regions. This dynamic causes several months of summer drought each year, making California one of the most fire prone regions globally. La Nina years extend summer droughts into the winter. Simultaneously, due to the clock‑wise circulation of the Pacific high, moisture carrying winds are pushed northward causing wet summers from Oregon to Alaska.
In combination with summer high pressure systems and low-pressure regions formed by rising convection in the tropics, the “ideal zonal flow” of westerly winds is disrupted, causing various jet stream wave patterns across the mid-latitudes. When a pattern of 5 or 7 waves encircles the globe, the waves resonate in such a way they cause storms to be somewhat blocked and move slower than normal. It is slower‑moving storms that generate the longer‑lasting extreme weather events such floods, droughts and heat waves. As seen in the illustration above (from Kornhuber 2020) when a pattern of 5 waves forms, heat waves are 20 times more likely in specific regions (in red) of North America, eastern Europe and eastern Asia. Because a pattern of 5 circum‑global waves tend to precede heat waves by 15–20 days, meteorologists have greatly increased their ability to forecast heat waves by including the state of planetary waves in their analyses. A similar resonance increases extreme weather events when patterns of 7 waves form. Fortunately, there is no evidence to suggest the earth is experiencing an increasing trend in blocking and resulting weather extremes. However, unaware that circum‑global wave guides can cause similar extreme weather around the globe, some climate scientists were misled to think that such extremes (i e. widespread heatwaves) could only be caused by a global blanket of CO2‑driven warming.
Still some events remain unpredictable. When the trough of a jet wave reaches its lowest point, it pinches off to form a “cut-off low” which makes the ensuing extreme weather highly unpredictable. Meteorologists nicknamed the cut-off low, the “weatherman’s woe” because cut-off lows can become stationary or flow against the general direction of the prevailing wind. Such a cut-off low formed over the Sahara Desert in the summer of 2019. The naturally heated desert air then moved northwestward, first bringing a heat wave to western Europe and then to Greenland where it caused extreme melting by raising temperatures 18°F above normal for 3 consecutive days. But yet again that Greenland melting was falsely attributed to amplification by CO2‑driven global warming while the natural climate dynamics were obscured.
El Nino Cycles Drive Global Warming and Modulate Planetary Wave formation
The ocean’s heat content naturally oscillates, discharging enough heat during an El Nino to create a net loss of ocean heat, then recharging and gaining enough heat during a La Nina for a net gain of ocean heat.
However, the heat gained during a La Nina is not completely balanced by the heat discharged during an El Nino. La Nina events usually last twice as long as El Nino events. Some El Ninos don’t fully discharge the ocean’s stored heat. Heat that is not released to the atmosphere remains sequestered below the surface for years and decades, contributing to the long‑term cycles of the Pacific Decadal Oscillation. According to Harvard and MIT oceanographers parts of the deep ocean is still cooling, releasing heat acquired centuries ago. Thus unbalanced El Nino/La Nina cycles will affect the long‑term heating or cooling of the oceans.
First consider the impacts during a La Nina. Climate scientists all agree that “under normal conditions, and even more so with La Nina,” east to west trade winds pile up warm waters in the western tropical Pacific. By removing warm solar‑heated water from the eastern Pacific, trade winds also cause cooler subsurface waters to upwell and replace the surface waters transported to the west. So during a La Nina a large temperature difference is created that further amplifies the trade winds (the Walker Circulation). Counter-intuitively the widespread upwelling of cooler water causes the average global temperature to decline while the ocean is gaining heat at greater depths.
During a La Nina the pile‑up of warm waters in the western Pacific increases the largest body of warm water on earth, aka the Indo-Pacific Warm Pool. Convection increases over the warm pool and strengthens the Asian and Australian summer monsoons. Regions of rising convection also move across the Indian and Pacific Ocean alternating warmer and cooler patches of the oceans every 30 to 60 days (Madden‑Julian Oscillation). Pressure from the growing Pacific warm pool pushes heated water through channels between the Indonesian Islands and increases temperatures in the Indian Ocean. Warmed Indian Ocean water can leak around the southern tip of Africa and adds heat to the Atlantic. Simultaneously, the northward flow of warm water increases along the eastern Asian coast via the Kuroshio current, as well as pushing warm water southward along the Australian west coast via the Leeuwin Current. An especially strong La Nina amplified the warm Leeuwin Current causing a marine heatwave along the western Australian coast in 2011, with severe coral bleaching and devastation to marine fisheries.
After that La Nina ended, the southward flow of warm Pacific water subsided allowing cooler southern waters to then flow equatorward. As a result the region began experiencing cold waves and a strong rebound in marine life from coral to fish. Such oscillating ocean temperatures and marine life productivity exemplifies how naturally dynamic climate change can affect biology. It also contradicts CO2‑driven predictions of steadily increasing warmth and increasing extinctions.
During an El Nino, all the phenomenon associated with a La Nina weaken or reverse. The trade winds weaken and warm waters surge eastward along the equator, causing sea level to fall in the west and rise in the east by as much as 25 cm. Discharging heat warms the ocean surface causing global temperatures to spike upwards. Warm water sloshing eastward reduces the west-east temperature difference, reducing the trade winds which reduces upwelling. During an El Nino the centers of rising warm air shifts eastward. Sometimes the warm El Nino waters only reach the center of the Pacific. At other times the warm waters reach the coast of the Americas and then move poleward up their coasts. In 1998 this caused heavy rains and floods in California. In the 1800s, warm water reaching the coast brought flooding to Ecuador and washed river crocodiles down to Peru, while heavy rains turned Peruvian deserts into grasslands. These constantly changing regions of convection naturally alter atmospheric waves that encircle the earth. Extreme weather events will depend on wave interactions.
During the Little Ice Age, according to Michael Mann and others, the temperature difference between the western and eastern Pacific Ocean was in an El Nino‑like condition. That does not mean the Pacific was constantly discharging heat. It means the La Nina-like or the negative Pacific Decadal Oscillation‑like conditions that are associated with recharging ocean heat were largely absent. This is consistent with observations of low sunspot minimums during the Little Ice Age and solar effects on the trade winds. Although some correctly argue observed changes in energy output during sunspot cycles is too low to directly explain the earth’s warming and cooling, small solar changes are amplified by ocean dynamics. Any decrease in solar irradiance cools the equator far more than higher latitudes. This decreases the north‑south temperature difference that drives the trade winds. Reduced trade winds cannot transport as much warm surface water westward into the warm pool reducing the monsoons and causing mega‑droughts in southeast Asia. Slower trade winds reduced upwelling in the eastern tropical Pacific. As evidenced in sediments along the Peruvian coast, reduced upwelling clearly reduced marine productivity during the Little Ice Age. As solar irradiance increased during the 20th century, so did the El Nino/La Nina cycles. Upwelling and marine productivity increased as the earth gradually warmed, and the earth exited the climate‑driven catastrophes of the Little Ice Age.
Tree ring studies similarly show PDO variability was also weak during the Little Ice Age, but strong during the Medieval Warm Period from 993 and 1300 AD. During the Medieval Warm Period, solar irradiance was higher and strong La Nina‑like conditions existed. With a larger Pacific warm pool, southeast Asian mega-droughts were absent but megadroughts devastated the western United States and Canada. As sunspot activity now wanes from it peaks in the 1950s and 1990s, we are provided with a natural experiment to evaluate how the Pacific Ocean will respond to lower sunspot activity. Will the monsoons and the Pacific Decadal Oscillation weaken as they did during the Little Ice Age?
Unfortunately for now, definitively distinguishing the causes of 20th century warming between greenhouse warming versus warming from climate dynamics is currently impossible. A simple experiment done at home using just an infrared thermometer gun can demonstrate why. Heat up a large pot of water, say to 150°F. Then turn off the heat. Measure the temperature of the pot’s surface water and randomly measure 9 spots on the kitchen floor. The average temperature would compute to about 78°F. That determines the “energy state of the kitchen”. Then scoop out half the water from the pot and throw it across the floor. Then repeat the measurements. The average temperature will be significantly higher, even though there was no added heat to the state of the kitchen. The warmer average was simply due to re-distribution of heat and the way the average surface temperature was calculated. Also notice the temperature of the pot will not have changed. One might argue that the water on the kitchen floor will quickly cool and the average temperature will revert back to the original state. But in real life, solar heated ocean water becomes saltier and denser due to evaporation. The warm water then sinks below the surface where its insulated for years.
Because we performed the experiment, we know that spreading the heat from the pot across the floor caused the average temperature to increase. However in nature we would need to precisely know the volume and degree of heat that has been re‑distributed across 3 dimensions. Our current technology and methods cannot precisely measure that. Scientists recently attempting to measure the discharge of ocean heat during an El Nino and reported quantities but with 25% uncertainty.
Scientists who assume recent global warming is due to rising CO2 concentrations have simply argued “there is no viable alternative explanation”. So they assume every change, warming or cooling, drought or flood, is due to rising CO2 concentrations. But atmospheric physicists have shown that CO2 concentrations in the lower atmosphere are now saturated, and the increased “competition” between greenhouse molecules greatly attenuates any additional greenhouse effect imparted by rising CO2 concentrations. At higher altitudes CO2 is not saturated, but because the stratosphere warms with increasing altitude, any increasing stratospheric CO2 will enhance the export of infrared to outer space and cool the earth. To attribute any global warming to rising CO2, the warming effect of redistribution of heat around the world must be precisely measured and factored out. How the calculation of the global average is affected by heat redistribution must be accurately ascertained. Until then, climate dynamics appear to be the better climate control knob and offer the best explanation for both a warming climate and episodes of extreme weather. And natural oscillations suggest a human caused climate crisis is highly unlikely!


 By Tom D. Tamarkin
 By Tom D. Tamarkin
 Dr. Antero Ollila